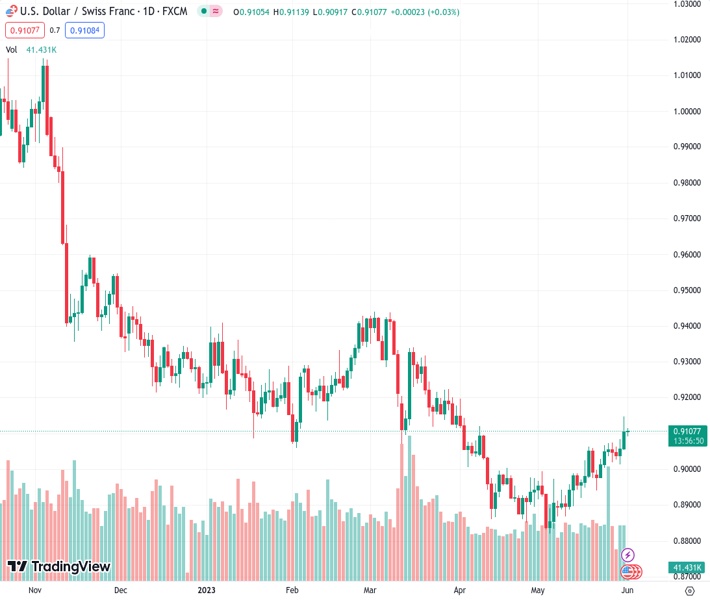
#USDCHF @ 0.91081 struggles to extend two-day uptrend at the highest levels since early April. (Pivot Orderbook analysis)
…
This is a premium post.
[s2If !current_user_can(access_s2member_level4)]Please register for FREE REGISTER to read full post below containing analysis. In case of any error or you think you are not able to read the full post below, please email us at support#nehcap.com [lwa][/s2If] [s2If current_user_can(access_s2member_level1)]
- USD/CHF struggles to extend two-day uptrend at the highest levels since early April.
- US Dollar lacks clear directions amid mixed sentiment, anxiety ahead of key data.
- Swiss trade numbers came in unimpressive for April.
- US preliminary activity data, employment numbers for May will be crucial for fresh impulse.
The pair currently trades last at 0.91081.
The previous day high was 0.9148 while the previous day low was 0.9056. The daily 38.2% Fib levels comes at 0.9113, expected to provide resistance. Similarly, the daily 61.8% fib level is at 0.9091, expected to provide support.
USD/CHF remains sidelined around 0.9110-15 as bulls and bears jostle ahead of the key data/events heading into Thursday’s European session. In doing so, the Swiss Franc (CHF) pair fails to justify the mixed prints of Swiss data, as well as anxiety before the top-tier events.
That said, the recent passage of the bill to overcome US default in the Republican-controlled House of Representatives underpins the cautious optimism ahead of tomorrow’s Senate voting on the debt-ceiling bill, which in turn should weigh on the USD/CHF price. On the same line, recently mixed US data and Federal Reserve (Fed) talks flag concerns that the US central bank has limited upside room for the rates. With this in mind, allowed Wall Street Journal’s (WSJ) Nick Timiraos to suggest that the Federal Open Market Committee (FOMC) is likely to hold interest rates steady in June.
Elsewhere, the Swiss Trade Balance eases to 2,601M in April from 4,526M (revised) prior. However, the Imports and Exports both rose from -22,505M and -27,031M respective previous readings to 17,302 and 19,902 in that order. It’s worth observing that the Swiss growth numbers and sentiment figures have also flashed mixed outcomes earlier in the week and prods the USD/CHF bears, mainly due to the broad US Dollar strength.
Amid these plays, the S&P500 Futures print mild gains to approach the 4,200 round figure, printing the first daily upside in three, whereas the US 10-year and two-year Treasury bond yields recover from weekly lows.
Looking ahead, the US ADP Employment Change and flash PMIs for May will be important to watch for clear directions. Also crucial will be the last round of the Fed talks ahead of the pre-FOMC blackout period for policymakers. Furthermore, the US Senators’ voting on the measures to avoid the default conditions should also be eyed closely even if the bill is likely to gain huge support in the Senate where Democrats are in the majority.
Also read: US ADP Employment, ISM Manufacturing PMI Preview: First down, then up for US Dollar?
USD/CHF grinds higher within a one-month-old bullish trend channel, currently between 0.9315 and 0.9165, amid price-positive oscillators.
Technical Levels: Supports and Resistances
USDCHF currently trading at 0.911 at the time of writing. Pair opened at 0.9106 and is trading with a change of 0.04% % .
| Overview | Overview.1 | |
|---|---|---|
| 0 | Today last price | 0.911 |
| 1 | Today Daily Change | 0.0004 |
| 2 | Today Daily Change % | 0.04% |
| 3 | Today daily open | 0.9106 |
The pair is trading above its 20 Daily moving average @ 0.8985, above its 50 Daily moving average @ 0.9005 , below its 100 Daily moving average @ 0.9131 and below its 200 Daily moving average @ 0.9381
| Trends | Trends.1 | |
|---|---|---|
| 0 | Daily SMA20 | 0.8985 |
| 1 | Daily SMA50 | 0.9005 |
| 2 | Daily SMA100 | 0.9131 |
| 3 | Daily SMA200 | 0.9381 |
The previous day high was 0.9148 while the previous day low was 0.9056. The daily 38.2% Fib levels comes at 0.9113, expected to provide resistance. Similarly, the daily 61.8% fib level is at 0.9091, expected to provide support.
Note the levels of interest below:
- Pivot support is noted at 0.9059, 0.9011, 0.8967
- Pivot resistance is noted at 0.9151, 0.9195, 0.9243
| Levels | Levels.1 |
|---|---|
| Previous Daily High | 0.9148 |
| Previous Daily Low | 0.9056 |
| Previous Weekly High | 0.9075 |
| Previous Weekly Low | 0.8941 |
| Previous Monthly High | 0.9148 |
| Previous Monthly Low | 0.8820 |
| Daily Fibonacci 38.2% | 0.9113 |
| Daily Fibonacci 61.8% | 0.9091 |
| Daily Pivot Point S1 | 0.9059 |
| Daily Pivot Point S2 | 0.9011 |
| Daily Pivot Point S3 | 0.8967 |
| Daily Pivot Point R1 | 0.9151 |
| Daily Pivot Point R2 | 0.9195 |
| Daily Pivot Point R3 | 0.9243 |
[/s2If]
Nehcap Expert Advisor
The NEHCAP MT4 EA is high quality professional trading system geared to generate returns without using GRID or martingales. Each trade has strict risk per trade parameter. The pairs under management include EURUSD, GBPUSD, AUDCAD, AUDNZD,GBPAUD, EURAUD, EURCAD, CHFJPY and many more.
The system is trading live: LIVE ACCOUNT TRACKING
You can run it free. Apply for a free trial and track our account. Buy the system or use profit share mechanism to generate returns on your MT4.
Join Our Telegram Group
")


