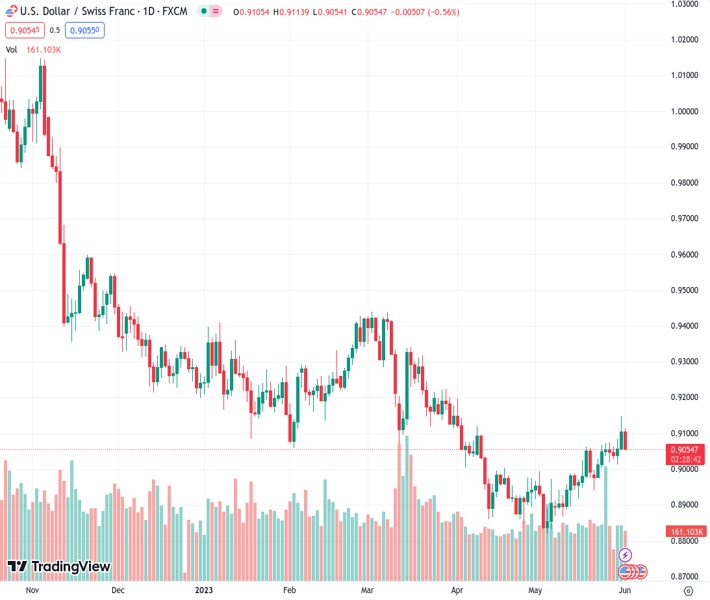
#USDCHF @ 0.90560 forms a bearish harami pattern, reversing from resistance at 0.9120 to exchange around 0.9050. (Pivot Orderbook analysis)
…
This is a premium post.
[s2If !current_user_can(access_s2member_level4)]Please register for FREE REGISTER to read full post below containing analysis. In case of any error or you think you are not able to read the full post below, please email us at support#nehcap.com [lwa][/s2If] [s2If current_user_can(access_s2member_level1)]
- USD/CHF forms a bearish harami pattern, reversing from resistance at 0.9120 to exchange around 0.9050.
- Despite a bullish RSI, the uptrend wanes due to strong resistance from the 100-day EMA and poor US economic data.
- The risk of a daily close below the 20-day EMA at 0.9058 poses a potential challenge to the 0.9000 mark.
The pair currently trades last at 0.90560.
The previous day high was 0.9148 while the previous day low was 0.9056. The daily 38.2% Fib levels comes at 0.9113, expected to provide resistance. Similarly, the daily 61.8% fib level is at 0.9091, expected to provide resistance.
USD/CHF pares some of its Wednesday’s gains, forming a bearish harami two candlestick pattern at a juncture with resistance at around the 0.9120 area, capping the advance of the major. Therefore, USD/CHF retreated below 0.9100 and exchanges hands around the 0.9050 area.
Since the beginning of the week, the USD/CHF meandered on top of the 50-day Exponential Moving Average (EMA) at 09034, which, acting as dynamic support, buyers saw it as a zone to open new positions, as the USD/CHF hit a fresh two-month high at around 0.9147. Nonetheless, the uptrend faded, as strong resistance emerged in the form of the 100-day EMA at 0.9127, alongside April 10 daily high at 0.9120.
Hence, bad US economic data was seen as an excuse for sellers to step in and drag the USD/CHF toward the lows of the day at 0.9054, below the 20-day EMA at 0.9058. In the outcome of a daily close below the latter, the next stop would be the 50-day EMA At 0.9034 before challenging the 0.9000 figure.
Even though price action remains neutral, in the short term, a pullback is likely. But traders should know that the Relative Strength Index (RSI) indicator is bullish, so upside risks remain.
Technical Levels: Supports and Resistances
USDCHF currently trading at 0.9056 at the time of writing. Pair opened at 0.9106 and is trading with a change of -0.55 % .
| Overview | Overview.1 | |
|---|---|---|
| 0 | Today last price | 0.9056 |
| 1 | Today Daily Change | -0.0050 |
| 2 | Today Daily Change % | -0.5500 |
| 3 | Today daily open | 0.9106 |
The pair is trading above its 20 Daily moving average @ 0.8985, above its 50 Daily moving average @ 0.9005 , below its 100 Daily moving average @ 0.9131 and below its 200 Daily moving average @ 0.9381
| Trends | Trends.1 | |
|---|---|---|
| 0 | Daily SMA20 | 0.8985 |
| 1 | Daily SMA50 | 0.9005 |
| 2 | Daily SMA100 | 0.9131 |
| 3 | Daily SMA200 | 0.9381 |
The previous day high was 0.9148 while the previous day low was 0.9056. The daily 38.2% Fib levels comes at 0.9113, expected to provide resistance. Similarly, the daily 61.8% fib level is at 0.9091, expected to provide resistance.
Note the levels of interest below:
- Pivot support is noted at 0.9059, 0.9011, 0.8967
- Pivot resistance is noted at 0.9151, 0.9195, 0.9243
| Levels | Levels.1 |
|---|---|
| Previous Daily High | 0.9148 |
| Previous Daily Low | 0.9056 |
| Previous Weekly High | 0.9075 |
| Previous Weekly Low | 0.8941 |
| Previous Monthly High | 0.9148 |
| Previous Monthly Low | 0.8820 |
| Daily Fibonacci 38.2% | 0.9113 |
| Daily Fibonacci 61.8% | 0.9091 |
| Daily Pivot Point S1 | 0.9059 |
| Daily Pivot Point S2 | 0.9011 |
| Daily Pivot Point S3 | 0.8967 |
| Daily Pivot Point R1 | 0.9151 |
| Daily Pivot Point R2 | 0.9195 |
| Daily Pivot Point R3 | 0.9243 |
[/s2If]
Nehcap Expert Advisor
The NEHCAP MT4 EA is high quality professional trading system geared to generate returns without using GRID or martingales. Each trade has strict risk per trade parameter. The pairs under management include EURUSD, GBPUSD, AUDCAD, AUDNZD,GBPAUD, EURAUD, EURCAD, CHFJPY and many more.
The system is trading live: LIVE ACCOUNT TRACKING
You can run it free. Apply for a free trial and track our account. Buy the system or use profit share mechanism to generate returns on your MT4.
Join Our Telegram Group
")


