Oil price recovers marginally after the House of Representatives votes through the debt-ceiling extension bill on Wednesday evening.
…
This is a premium post.
[s2If !current_user_can(access_s2member_level4)]Please register for FREE REGISTER to read full post below containing analysis. In case of any error or you think you are not able to read the full post below, please email us at support#nehcap.com [lwa][/s2If] [s2If current_user_can(access_s2member_level1)]
- Oil price recovers marginally after the House of Representatives votes through the debt-ceiling extension bill on Wednesday evening.
- Gains are capped by higher-than-expected inventory levels from the API, suggesting ample supply.
- Several Fed officials signal a “pause” may be appropriate at June meeting, though peak rate may be higher.
Oil price trades flat in the upper $67s (Brent in the lower $72s) on Thursday after making a small recovery from just above $67 reached the day before when sellers dominated the market. The rebound came after the US debt-ceiling extension bill was successfully voted through the House of Representatives, late on Wednesday evening. Oil price gained further support after several US Federal Reserve (Fed) officials said they thought interest rates should be left as they are at the next Fed meeting. Those gains were capped, however, after data from the American Petroleum Institute (API) showed a larger-than-expected rise in Oil inventories, indicating ample supply.
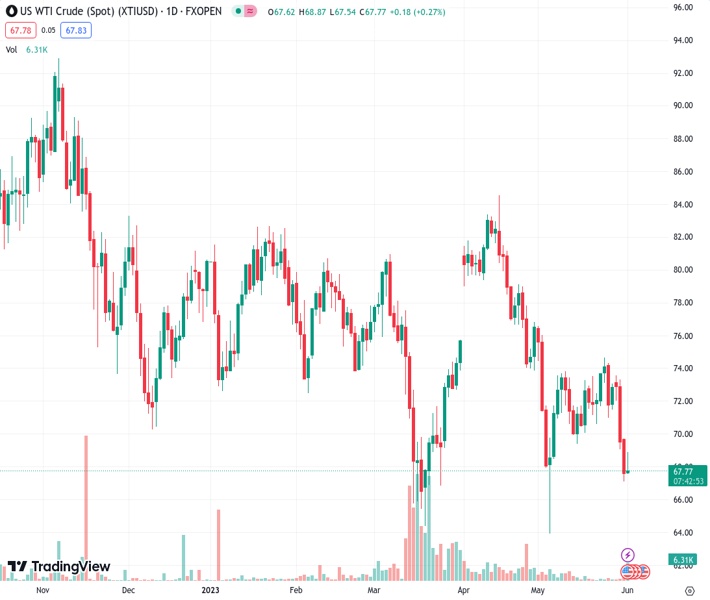
WTI Oil price continues to decline as the longer-term bearish trend extends. Given the old saying about the trend being your friend, this favors short sellers over longs. WTI Oil is trading below all the major daily and weekly Simple Moving Averages (SMAs) but has found support at the 200-week SMA at $66.90 from where it is making an intraday recovery.
WTI US Oil: Weekly Chart
Oil price has decisively broken below the May 22 lows of $70.65 as well as the $69.40 May 15 lows. Only the 200-week SMA now stands in the way of further losses. If it breaks below that too, it could lead to further weakness down to the year-to-date (YTD) lows of $64.31.
WTI US Oil: Daily Chart
A break below the YTD lows would reignite the downtrend, with the next target at around $62.00, where trough lows from 2021 will come into play, followed by support at $57.50.
Oil price needs to climb back above the $74.70 May 24 highs to raise doubts about the dominant bearish trend.
Such a break might lead to a potential target in the $79.70s, which roughly coincides with the 200-day SMA and the main trendline for the bear market, heightening its importance as a key resistance level.
The long hammer Japanese candlestick pattern that formed at the May 4 (and YTD) lows is a sign that Oil price may have formed a strategic bottom at that level.
[/s2If]
Nehcap Expert Advisor
The NEHCAP MT4 EA is high quality professional trading system geared to generate returns without using GRID or martingales. Each trade has strict risk per trade parameter. The pairs under management include EURUSD, GBPUSD, AUDCAD, AUDNZD,GBPAUD, EURAUD, EURCAD, CHFJPY and many more.
The system is trading live: LIVE ACCOUNT TRACKING
You can run it free. Apply for a free trial and track our account. Buy the system or use profit share mechanism to generate returns on your MT4.
Join Our Telegram Group
")


