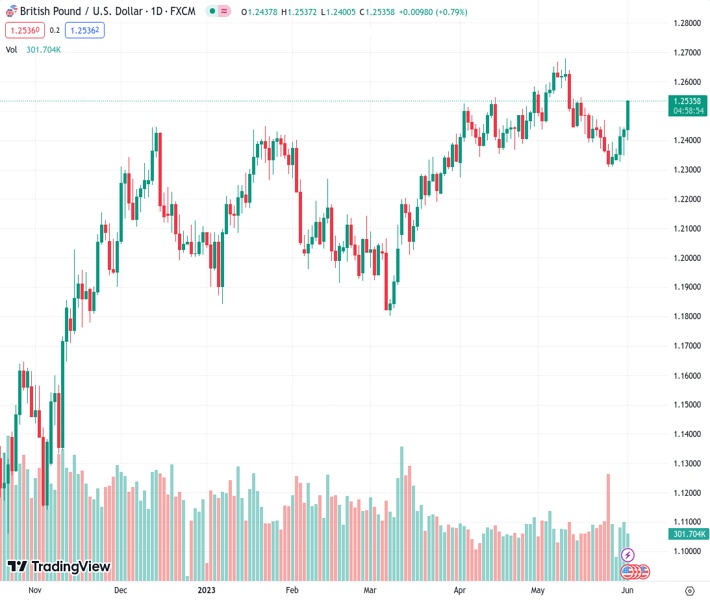
#GBPUSD @ 1.25351 rises amid weak US data and potential Fed policy pause. (Pivot Orderbook analysis)
…
This is a premium post.
[s2If !current_user_can(access_s2member_level4)]Please register for FREE REGISTER to read full post below containing analysis. In case of any error or you think you are not able to read the full post below, please email us at support#nehcap.com [lwa][/s2If] [s2If current_user_can(access_s2member_level1)]
- GBP/USD rises amid weak US data and potential Fed policy pause.
- Despite ISM’s seven-month PMI slump, Wall Street remains positive.
- The UK faces steep housing price fall; high inflation triggers BoE tightening speculation.
The pair currently trades last at 1.25351.
The previous day high was 1.2444 while the previous day low was 1.2348. The daily 38.2% Fib levels comes at 1.2408, expected to provide support. Similarly, the daily 61.8% fib level is at 1.2385, expected to provide support.
GBP/USD edges higher in the North American session, boosted by downbeat economic data from the United States (US), with business activity slowing. Additionally, US Federal Reserve (Fed) officials pushing for a “skip” on its tightening cycle eased the odds for a rate hike at the upcoming June meeting. The GBP/USD is trading at around 1.2510s after hitting a low of 1.2400.
Wall Street shifted positively as data from the Institute for Supply Management (ISM) revealed that manufacturing activity slid for the seven straight month. The ISM Manufacturing PMI came at 46.9, below April’s 47.1 and below estimates of 47, with readings below 50 seen as recessionary. Factors like 500 basis points (bps) of aggressive tightening by the Fed weighed on the index as new orders plunged.
ISM data weighed heavily on the US Dollar (USD), as shown by the GBP/USD skyrocketing from around 1.2470, back above 1.2500, following the release of another two US employment reports, triggering a bounce from 1.2440 towards the former.
Regarding employment, the ADP National Employment Report showed private hiring rose by 278K in May, crushing estimates of 170K, but trailed April’s astonishing 291K. Although it showed signs the labor market remains tight, that was further confirmed by US unemployment claims.
Initial Jobless Claims for the week ended May 27 rose by 232K, below estimates of 235K, but above the prior’s week 230K, a figure downward revised.
Given the latest round of data, the Philadelphia Fed President Patrick Harker is expected to deliver some remarks late in the day. Nonetheless, GBP/USD traders should remember the latest statements by Fed Governor Philip Jefferson aiming for a skip to raise rates at June’s meeting, comments supported by Harker. Nevertheless, Harker added that incoming data could “change my mind.”
Across the pond, the UK calendar revealed that housing prices fell the most since 2009, blamed on higher interest rates by the Bank of England (BoE). The latest inflation report shows signs of easing but remains four times the BoE’s target. After the release of the Consumer Price Index (CPI), investors priced in additional tightening by the BoE.
The GBP/USD resumed its upward trajectory after spending two days glued to the bottom of the 20-day Exponential Moving Average (EMA) at 1.2441. Fundamental News sponsored Cable appreciation, and since it claimed the 1.2500 figure, the path of least resistance is north. The following resistance levels lie at the May 16 high of 1.2546 and the 1.2600 figure. Technical indicators, like the Relative Strength Index (RSI) and the 3-day Rate of Change (RoC), show that bulls are gathering momentum, so any pullbacks could be seen to re-engage on the overall uptrend.
Technical Levels: Supports and Resistances
GBPUSD currently trading at 1.2523 at the time of writing. Pair opened at 1.244 and is trading with a change of 0.67 % .
| Overview | Overview.1 | |
|---|---|---|
| 0 | Today last price | 1.2523 |
| 1 | Today Daily Change | 0.0083 |
| 2 | Today Daily Change % | 0.6700 |
| 3 | Today daily open | 1.2440 |
The pair remains strongly bullish on the daily timeframe. It trades above its 20 SMA @ 1.2474, 50 SMA 1.2444, 100 SMA @ 1.2295 and 200 SMA @ 1.1987.
| Trends | Trends.1 | |
|---|---|---|
| 0 | Daily SMA20 | 1.2474 |
| 1 | Daily SMA50 | 1.2444 |
| 2 | Daily SMA100 | 1.2295 |
| 3 | Daily SMA200 | 1.1987 |
The previous day high was 1.2444 while the previous day low was 1.2348. The daily 38.2% Fib levels comes at 1.2408, expected to provide support. Similarly, the daily 61.8% fib level is at 1.2385, expected to provide support.
Note the levels of interest below:
- Pivot support is noted at 1.2377, 1.2315, 1.2281
- Pivot resistance is noted at 1.2474, 1.2507, 1.257
| Levels | Levels.1 |
|---|---|
| Previous Daily High | 1.2444 |
| Previous Daily Low | 1.2348 |
| Previous Weekly High | 1.2472 |
| Previous Weekly Low | 1.2308 |
| Previous Monthly High | 1.2680 |
| Previous Monthly Low | 1.2308 |
| Daily Fibonacci 38.2% | 1.2408 |
| Daily Fibonacci 61.8% | 1.2385 |
| Daily Pivot Point S1 | 1.2377 |
| Daily Pivot Point S2 | 1.2315 |
| Daily Pivot Point S3 | 1.2281 |
| Daily Pivot Point R1 | 1.2474 |
| Daily Pivot Point R2 | 1.2507 |
| Daily Pivot Point R3 | 1.2570 |
[/s2If]
Nehcap Expert Advisor
The NEHCAP MT4 EA is high quality professional trading system geared to generate returns without using GRID or martingales. Each trade has strict risk per trade parameter. The pairs under management include EURUSD, GBPUSD, AUDCAD, AUDNZD,GBPAUD, EURAUD, EURCAD, CHFJPY and many more.
The system is trading live: LIVE ACCOUNT TRACKING
You can run it free. Apply for a free trial and track our account. Buy the system or use profit share mechanism to generate returns on your MT4.
Join Our Telegram Group
")


