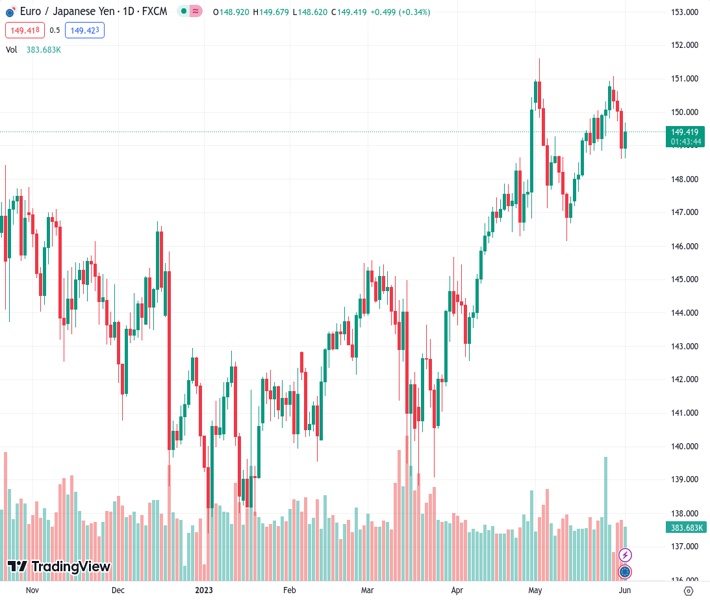
#EURJPY @ 149.424 retakes the 149.00 area after three days of losses. (Pivot Orderbook analysis)
…
This is a premium post.
[s2If !current_user_can(access_s2member_level4)]Please register for FREE REGISTER to read full post below containing analysis. In case of any error or you think you are not able to read the full post below, please email us at support#nehcap.com [lwa][/s2If] [s2If current_user_can(access_s2member_level1)]
- EUR/JPY retakes the 149.00 area after three days of losses.
- Headline and Core HICP decelerated to 6.1% and 5.3% YoY in May in the EZ.
- ECB’s Christine Lagarde stated that she is not satisfied with the inflation outlook.
The pair currently trades last at 149.424.
The previous day high was 150.12 while the previous day low was 148.59. The daily 38.2% Fib levels comes at 149.17, expected to provide support. Similarly, the daily 61.8% fib level is at 149.54, expected to provide resistance.
The EUR/JPY rebounded towards the 149.35 area after the bears got rejected at the 20-day Simple Moving Average (SMA) following three consecutive days of losses, and reached a daily high of 149.67. The Euro gained traction on the back of hawkish Christine Lagarde remarks despite the release of inflation figures from the Eurozone (EZ) from May which showed a deceleration in prices. On the other hand, the Japanese Yen weakened against most of its rivals but managed to strengthen against the US Dollar. For Thursday’s session, the Japanese economic calendar won’t have anything relevant to offer.
The European Union (EU) Harmonized Index of Consumer Prices (HICP), continued to decline in April as the headline figure came in at 6.1% (YoY) vs the 6.3% expected. The Core reading also decelerated to 5.3% YoY vs 5.5% expected from the previous 5.6%. Other data showed that the Unemployment Rate came in at 6.5% matching the consensus.
As a reaction, the German yields declined across the board. The 10-year bond yield is trading at 2.25%, having declined by 0.29 % on the day. The 2-year yield stands at 2.73% with a 0.49% decline and the 5-year yield is at 2.24% seeing a 0.29% retraction.
However, the Euro managed to hold its ground on the back of European Central Bank’s (ECB) president Christine Lagarde’s hawkish remarks. She highlighted concerns about persistently high inflation and its prolonged duration, emphasizing that the interest rate hikes are already exerting a significant impact on bank lending conditions, while also expressing dissatisfaction with the current inflation outlook.
The EUR/JPY has a neutral outlook as per the daily chart while the Relative Strength Index (RSI) remains above 50 and the Moving Average Convergence Divergence (MACD) prints red bars. The 4-hour chart also suggests that neither the sellers nor the buyers have the control as indicators turned somewhat flat, seeming to be awaiting direction.
In case the EUR/JPY continues to gain traction, the following resistance line up at the 149.50 zone followed by the daily high near 149.70 and the psychological mark at 150.00. In addition,the 20-day Simple Moving Average (SMA) at 148.80 level is key for EUR/JPY. If breached, the pair could see a more pronounced decline towards the 148.50 area and 148.00 zone.
Technical Levels: Supports and Resistances
EURJPY currently trading at 149.43 at the time of writing. Pair opened at 148.94 and is trading with a change of 0.33 % .
| Overview | Overview.1 | |
|---|---|---|
| 0 | Today last price | 149.43 |
| 1 | Today Daily Change | 0.49 |
| 2 | Today Daily Change % | 0.33 |
| 3 | Today daily open | 148.94 |
The pair remains strongly bullish on the daily timeframe. It trades above its 20 SMA @ 148.91, 50 SMA 147.09, 100 SMA @ 144.63 and 200 SMA @ 143.86.
| Trends | Trends.1 | |
|---|---|---|
| 0 | Daily SMA20 | 148.91 |
| 1 | Daily SMA50 | 147.09 |
| 2 | Daily SMA100 | 144.63 |
| 3 | Daily SMA200 | 143.86 |
The previous day high was 150.12 while the previous day low was 148.59. The daily 38.2% Fib levels comes at 149.17, expected to provide support. Similarly, the daily 61.8% fib level is at 149.54, expected to provide resistance.
Note the levels of interest below:
- Pivot support is noted at 148.32, 147.69, 146.79
- Pivot resistance is noted at 149.84, 150.74, 151.37
| Levels | Levels.1 |
|---|---|
| Previous Daily High | 150.12 |
| Previous Daily Low | 148.59 |
| Previous Weekly High | 150.94 |
| Previous Weekly Low | 148.84 |
| Previous Monthly High | 151.62 |
| Previous Monthly Low | 146.14 |
| Daily Fibonacci 38.2% | 149.17 |
| Daily Fibonacci 61.8% | 149.54 |
| Daily Pivot Point S1 | 148.32 |
| Daily Pivot Point S2 | 147.69 |
| Daily Pivot Point S3 | 146.79 |
| Daily Pivot Point R1 | 149.84 |
| Daily Pivot Point R2 | 150.74 |
| Daily Pivot Point R3 | 151.37 |
[/s2If]
Nehcap Expert Advisor
The NEHCAP MT4 EA is high quality professional trading system geared to generate returns without using GRID or martingales. Each trade has strict risk per trade parameter. The pairs under management include EURUSD, GBPUSD, AUDCAD, AUDNZD,GBPAUD, EURAUD, EURCAD, CHFJPY and many more.
The system is trading live: LIVE ACCOUNT TRACKING
You can run it free. Apply for a free trial and track our account. Buy the system or use profit share mechanism to generate returns on your MT4.
Join Our Telegram Group
")


