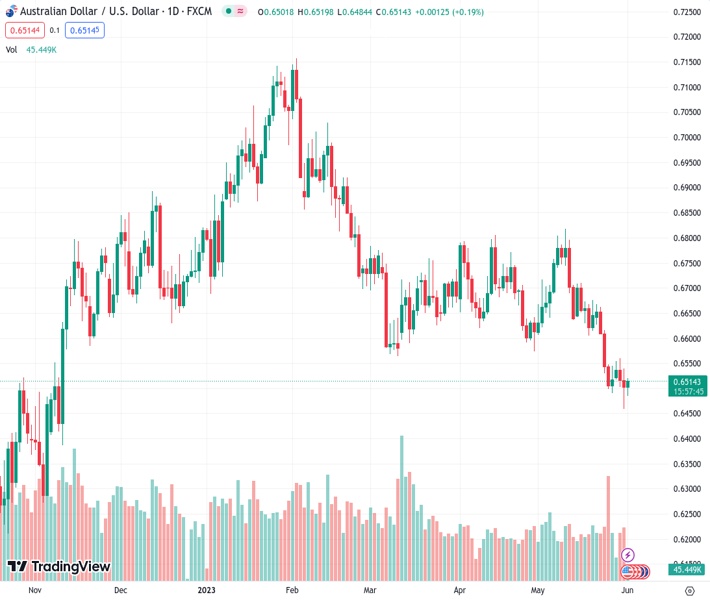
#AUDUSD @ 0.65143 picks up bids to refresh intraday high, snaps two-day downtrend., @nehcap view: Limited upside expected (Pivot Orderbook analysis)
…
This is a premium post.
[s2If !current_user_can(access_s2member_level4)]Please register for FREE REGISTER to read full post below containing analysis. In case of any error or you think you are not able to read the full post below, please email us at support#nehcap.com [lwa][/s2If] [s2If current_user_can(access_s2member_level1)]
- AUD/USD picks up bids to refresh intraday high, snaps two-day downtrend.
- Upbeat China Caixin Manufacturing PMI, US debt-ceiling bill passage in the House favor bulls.
- Bulls sneak in from seven-month-old descending support line but multiple hurdle prod further upside.
- Bearish MACD signals, challenges to risk-on mood and hawkish Fed bets keep Aussie sellers hopeful.
The pair currently trades last at 0.65143.
The previous day high was 0.654 while the previous day low was 0.6458. The daily 38.2% Fib levels comes at 0.6489, expected to provide support. Similarly, the daily 61.8% fib level is at 0.6509, expected to provide support.
AUD/USD prints the first daily gains in three around 0.6520 as cautious optimism in the market joins the mixed concerns about Federal Reserve (Fed) to recall buyers early Thursday.
However, the looming employment clues from the US and impending voting on the US debt-ceiling bill in the Senate check the risk-barometer buyers. It’s worth noting that upbeat China’s upbeat Caixin Manufacturing PMI for May also underpinned the pair’s upside moves.
Technically, the AUD/USD pair bounces off a descending support line from December 20, 2022, close to the 0.6500 round figure by the press time. The same joins the aforementioned catalysts to allow the Aussie pair to aim for a three-week-old descending resistance line, near 0.6545, to restrict the immediate upside of the quote.
Following that, the 61.8% Fibonacci retracement level of the pair’s October 2022 to February 2023 upside, near 0.6550, quickly followed by the 10-DMA hurdle of 0.6555, could tease the AUD/USD sellers.
It’s worth observing that a successful break of 0.6555 can escalate the quote’s short-term rebound.
Meanwhile, AUD/USD sellers need to conquer the aforementioned support line of around 0.6500 for conviction. Even so, the latest bottom of around 0.6455 can challenge the bears before returning control to them.
Trend: Limited upside expected
Technical Levels: Supports and Resistances
AUDUSD currently trading at 0.6519 at the time of writing. Pair opened at 0.6503 and is trading with a change of 0.25% % .
| Overview | Overview.1 | |
|---|---|---|
| 0 | Today last price | 0.6519 |
| 1 | Today Daily Change | 0.0016 |
| 2 | Today Daily Change % | 0.25% |
| 3 | Today daily open | 0.6503 |
The pair remains strongly bearish on the daily time frame. It trades below the 20 SMA @ 0.6639, 50 SMA 0.6667, 100 SMA @ 0.6762 and 200 SMA @ 0.6698.
| Trends | Trends.1 | |
|---|---|---|
| 0 | Daily SMA20 | 0.6639 |
| 1 | Daily SMA50 | 0.6667 |
| 2 | Daily SMA100 | 0.6762 |
| 3 | Daily SMA200 | 0.6698 |
The previous day high was 0.654 while the previous day low was 0.6458. The daily 38.2% Fib levels comes at 0.6489, expected to provide support. Similarly, the daily 61.8% fib level is at 0.6509, expected to provide support.
Note the levels of interest below:
- Pivot support is noted at 0.6461, 0.6419, 0.6379
- Pivot resistance is noted at 0.6542, 0.6582, 0.6624
| Levels | Levels.1 |
|---|---|
| Previous Daily High | 0.6540 |
| Previous Daily Low | 0.6458 |
| Previous Weekly High | 0.6668 |
| Previous Weekly Low | 0.6490 |
| Previous Monthly High | 0.6818 |
| Previous Monthly Low | 0.6458 |
| Daily Fibonacci 38.2% | 0.6489 |
| Daily Fibonacci 61.8% | 0.6509 |
| Daily Pivot Point S1 | 0.6461 |
| Daily Pivot Point S2 | 0.6419 |
| Daily Pivot Point S3 | 0.6379 |
| Daily Pivot Point R1 | 0.6542 |
| Daily Pivot Point R2 | 0.6582 |
| Daily Pivot Point R3 | 0.6624 |
[/s2If]
Nehcap Expert Advisor
The NEHCAP MT4 EA is high quality professional trading system geared to generate returns without using GRID or martingales. Each trade has strict risk per trade parameter. The pairs under management include EURUSD, GBPUSD, AUDCAD, AUDNZD,GBPAUD, EURAUD, EURCAD, CHFJPY and many more.
The system is trading live: LIVE ACCOUNT TRACKING
You can run it free. Apply for a free trial and track our account. Buy the system or use profit share mechanism to generate returns on your MT4.
Join Our Telegram Group
")


