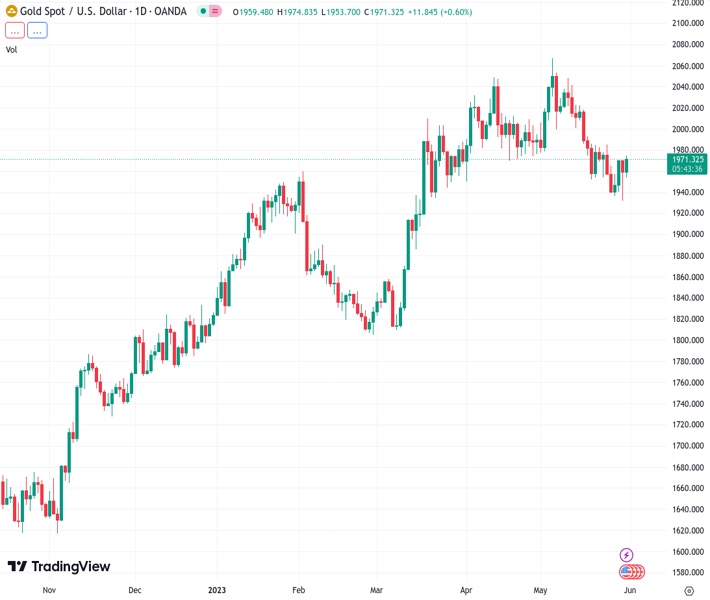
#XAUUSD @ 1971.57 Gold prices rise slide in Wall Street, supported by a decrease in government bond yields. (Pivot Orderbook analysis)
…
This is a premium post.
[s2If !current_user_can(access_s2member_level4)]Please register for FREE REGISTER to read full post below containing analysis. In case of any error or you think you are not able to read the full post below, please email us at support#nehcap.com [lwa][/s2If] [s2If current_user_can(access_s2member_level1)]
- Gold prices rise slide in Wall Street, supported by a decrease in government bond yields.
- Following a brief pullback in response to the US Job Openings report, XAU/USD rebounded to weekly highs.
The pair currently trades last at 1971.57.
The previous day high was 1963.56 while the previous day low was 1932.12. The daily 38.2% Fib levels comes at 1951.55, expected to provide support. Similarly, the daily 61.8% fib level is at 1944.13, expected to provide support.
Gold prices are up for the second consecutive day on Wednesday, driven by lower government bond yields. The yellow metal reached its highest level in a week and is trading above $1,970.
After the opening bell on Wall Street, XAU/USD gained momentum and rose above $1,970. However, following the release of the US Job Openings report, it pulled back to $1,960, only to rebound later to $1,974, hitting a fresh weekly high.
US data released so far on Wednesday has been mixed. The JOLTS Job Openings came in at 10.10 million in April, against expectations of a decrease to 9.73 million. Meanwhile, the Chicago PMI showed a sharp decline in May from 48.6 to 40.4, against expectations of 47. These economic figures triggered market volatility. On Thursday, the ADP Employment report and the weekly Jobless Claims are due, while on Friday, the official Employment report will be released.
Although the US Dollar Index is up by 0.45%, it is not limiting Gold’s gains. The key driver on Wednesday has been government bond yields. The 10-year Treasury yield is at 3.65%, the lowest in more than a week, while the German 10-year reference dropped to 2.24%, the lowest in two weeks. Market jitters and easing inflation in Europe are supporting the rally in bonds.
The short-term outlook for Gold looks positive while trading above $1,955, with resistance expected around $1,970. A clear consolidation above this level would keep the door open for further gains. The next strong resistance could be seen at the 20 and 55-day Simple Moving Averages, currently at $1,988.
Technical Levels: Supports and Resistances
XAUUSD currently trading at 1969.96 at the time of writing. Pair opened at 1959.28 and is trading with a change of 0.55 % .
| Overview | Overview.1 | |
|---|---|---|
| 0 | Today last price | 1969.96 |
| 1 | Today Daily Change | 10.68 |
| 2 | Today Daily Change % | 0.55 |
| 3 | Today daily open | 1959.28 |
The pair is trading below its 20 Daily moving average @ 1991.79, below its 50 Daily moving average @ 1991.7 , above its 100 Daily moving average @ 1936.74 and above its 200 Daily moving average @ 1832.52
| Trends | Trends.1 | |
|---|---|---|
| 0 | Daily SMA20 | 1991.79 |
| 1 | Daily SMA50 | 1991.70 |
| 2 | Daily SMA100 | 1936.74 |
| 3 | Daily SMA200 | 1832.52 |
The previous day high was 1963.56 while the previous day low was 1932.12. The daily 38.2% Fib levels comes at 1951.55, expected to provide support. Similarly, the daily 61.8% fib level is at 1944.13, expected to provide support.
Note the levels of interest below:
- Pivot support is noted at 1939.75, 1920.21, 1908.31
- Pivot resistance is noted at 1971.19, 1983.09, 2002.63
| Levels | Levels.1 |
|---|---|
| Previous Daily High | 1963.56 |
| Previous Daily Low | 1932.12 |
| Previous Weekly High | 1985.30 |
| Previous Weekly Low | 1936.77 |
| Previous Monthly High | 2048.75 |
| Previous Monthly Low | 1949.83 |
| Daily Fibonacci 38.2% | 1951.55 |
| Daily Fibonacci 61.8% | 1944.13 |
| Daily Pivot Point S1 | 1939.75 |
| Daily Pivot Point S2 | 1920.21 |
| Daily Pivot Point S3 | 1908.31 |
| Daily Pivot Point R1 | 1971.19 |
| Daily Pivot Point R2 | 1983.09 |
| Daily Pivot Point R3 | 2002.63 |
[/s2If]
Nehcap Expert Advisor
The NEHCAP MT4 EA is high quality professional trading system geared to generate returns without using GRID or martingales. Each trade has strict risk per trade parameter. The pairs under management include EURUSD, GBPUSD, AUDCAD, AUDNZD,GBPAUD, EURAUD, EURCAD, CHFJPY and many more.
The system is trading live: LIVE ACCOUNT TRACKING
You can run it free. Apply for a free trial and track our account. Buy the system or use profit share mechanism to generate returns on your MT4.
Join Our Telegram Group
")


