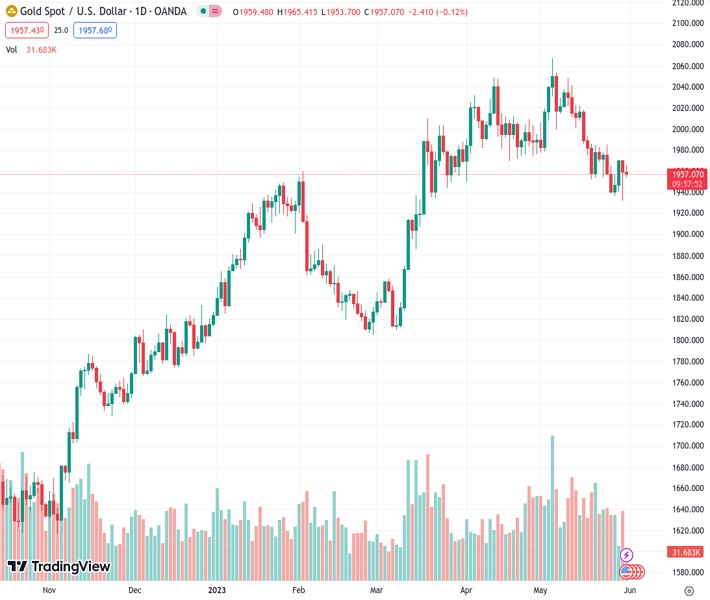
#XAUUSD @ 1,957.28 Gold price oscillates in a narrow range just below a one-week high touched this Wednesday. (Pivot Orderbook analysis)
…
This is a premium post.
[s2If !current_user_can(access_s2member_level4)]Please register for FREE REGISTER to read full post below containing analysis. In case of any error or you think you are not able to read the full post below, please email us at support#nehcap.com [lwa][/s2If] [s2If current_user_can(access_s2member_level1)]
- Gold price oscillates in a narrow range just below a one-week high touched this Wednesday.
- The emergence of fresh US Dollar buying and hawkish Federal Reserve expectations cap gains.
- Economic woes overshadow the US debt ceiling optimism and limit losses for the XAU/USD.
The pair currently trades last at 1957.28.
The previous day high was 1963.56 while the previous day low was 1932.12. The daily 38.2% Fib levels comes at 1951.55, expected to provide support. Similarly, the daily 61.8% fib level is at 1944.13, expected to provide support.
Gold price struggles to capitalize on the overnight bounce from the $1,932 region, or its lowest level since March 17 and seesaws between tepid gains/minor losses through the first half of the European session on Wednesday. The XAU/USD currently trades around the $1.960 level, nearly unchanged for the day and just below a one-week high touched earlier today.
A combination of supporting factors lifts the US Dollar (USD) to over a two-month high, which, in turn, acts as a headwind for Gold price. The legislation brokered by United States (US) President Joe Biden and House Speaker Kevin McCarthy to lift the $31.4 trillion debt ceiling and achieve new federal spending cuts passed an important hurdle late on Tuesday. In fact, the bill cleared its first procedural hurdle on Tuesday as the House Rules Committee voted 7-6 to advance it to the floor for a debate and a final passage vote on Wednesday. This, along with expectations that the Federal Reserve (Fed) will likely raise interest rates, provides a goodish lift to the Greenback.
Investors now seem convinced that the US central bank will keep interest rates higher for longer and are now pricing in a greater chance of another 25 bps lift-off at the next Federal Open Market Committee (FOMC) policy meeting in June. The bets were lifted by the US Personal Consumption Expenditures Price Index – the Fed’s preferred inflation gauge – released on Friday, which indicated that inflation remains sticky. This further contributes to capping the upside for the non-yielding Gold price. That said, the risk-off impulse is seen lending some support to the safe-haven precious metal and helping limit the downside, warranting caution for bearish traders.
The market sentiment remains fragile amid worries about slowing global economic growth, particularly in China. The National Bureau of Statistics (NBS) reported that China’s factory activity shrank faster than expected and the official Manufacturing PMI fell to a five-month low of 48.8 in May. Furthermore, service sector activity expanded at the slowest pace in four months and the official non-manufacturing PMI fell to 54.5 in May from 56.4 previous, fueling recession fears and tempering investors’ appetite for riskier assets. The anti-risk flow, meanwhile, leads to a further decline in the US Treasury bond yields, which caps the USD and could benefit the XAU/USD.
The aforementioned mixed fundamental backdrop is more likely to hold back traders from positioning for an extension of the overnight bounce from the 100-day Simple Moving Average (SMA) or the recent pullback from an all-time high touched earlier this month. Market participants now look forward to the US economic docket, featuring the release of the Chicago PMI and JOLTS Job Openings later during the early North American session. This, along with speeches by influential FOMC members and the US bond yields, will drive the USD demand. Apart from this, the broader risk sentiment could provide some meaningful impetus to Gold price.
From a technical perspective, any subsequent move up beyond the daily peak, around the $1,965 region, could attract fresh sellers and remain capped near the $1.980 region. The latter should act as a pivotal point, which if cleared could allow the Gold price to reclaim the $2.000 psychological mark. On the flip side, the $1,943 area seems to protect the immediate downside ahead of the 100-day Simple Moving Average (SMA) and the multi-month low, around the $1,932 region. A convincing break below the said support levels will be seen as a fresh trigger for bearish traders and drag the XAU/USD further towards the $1,900 round-figure mark
Technical Levels: Supports and Resistances
XAUUSD currently trading at 1957.19 at the time of writing. Pair opened at 1959.28 and is trading with a change of -0.11 % .
| Overview | Overview.1 | |
|---|---|---|
| 0 | Today last price | 1957.19 |
| 1 | Today Daily Change | -2.09 |
| 2 | Today Daily Change % | -0.11 |
| 3 | Today daily open | 1959.28 |
The pair is trading below its 20 Daily moving average @ 1991.79, below its 50 Daily moving average @ 1991.7 , above its 100 Daily moving average @ 1936.74 and above its 200 Daily moving average @ 1832.52
| Trends | Trends.1 | |
|---|---|---|
| 0 | Daily SMA20 | 1991.79 |
| 1 | Daily SMA50 | 1991.70 |
| 2 | Daily SMA100 | 1936.74 |
| 3 | Daily SMA200 | 1832.52 |
The previous day high was 1963.56 while the previous day low was 1932.12. The daily 38.2% Fib levels comes at 1951.55, expected to provide support. Similarly, the daily 61.8% fib level is at 1944.13, expected to provide support.
Note the levels of interest below:
- Pivot support is noted at 1939.75, 1920.21, 1908.31
- Pivot resistance is noted at 1971.19, 1983.09, 2002.63
| Levels | Levels.1 |
|---|---|
| Previous Daily High | 1963.56 |
| Previous Daily Low | 1932.12 |
| Previous Weekly High | 1985.30 |
| Previous Weekly Low | 1936.77 |
| Previous Monthly High | 2048.75 |
| Previous Monthly Low | 1949.83 |
| Daily Fibonacci 38.2% | 1951.55 |
| Daily Fibonacci 61.8% | 1944.13 |
| Daily Pivot Point S1 | 1939.75 |
| Daily Pivot Point S2 | 1920.21 |
| Daily Pivot Point S3 | 1908.31 |
| Daily Pivot Point R1 | 1971.19 |
| Daily Pivot Point R2 | 1983.09 |
| Daily Pivot Point R3 | 2002.63 |
[/s2If]
Nehcap Expert Advisor
The NEHCAP MT4 EA is high quality professional trading system geared to generate returns without using GRID or martingales. Each trade has strict risk per trade parameter. The pairs under management include EURUSD, GBPUSD, AUDCAD, AUDNZD,GBPAUD, EURAUD, EURCAD, CHFJPY and many more.
The system is trading live: LIVE ACCOUNT TRACKING
You can run it free. Apply for a free trial and track our account. Buy the system or use profit share mechanism to generate returns on your MT4.
Join Our Telegram Group
")


