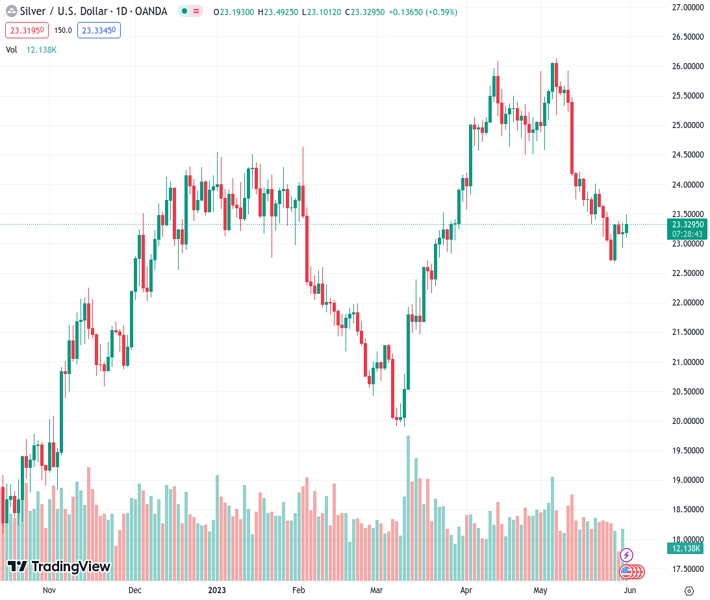
#XAGUSD @ 23.300 Silver climbs to a one-week high on Wednesday, albeit lacks follow-through. (Pivot Orderbook analysis)
…
This is a premium post.
[s2If !current_user_can(access_s2member_level4)]Please register for FREE REGISTER to read full post below containing analysis. In case of any error or you think you are not able to read the full post below, please email us at support#nehcap.com [lwa][/s2If] [s2If current_user_can(access_s2member_level1)]
- Silver climbs to a one-week high on Wednesday, albeit lacks follow-through.
- The technical setup warrants some caution before placing fresh bullish bets.
- A sustained move beyond the $23.70-75 area would negate the bearish bias.
The pair currently trades last at 23.300.
The previous day high was 23.34 while the previous day low was 22.93. The daily 38.2% Fib levels comes at 23.19, expected to provide support. Similarly, the daily 61.8% fib level is at 23.09, expected to provide support.
Silver attracts fresh buying following the previous day’s two-way price moves and climbs to a one-week high, around the $23.50 area on Wednesday. The white metal, however, struggles to capitalize on the move or find acceptance above the 100-day Simple Moving Average (SMA) and retreats to the $23.30 region during the early North American session.
Oscillators on the daily chart, meanwhile, have been recovering from lower levels, though are still holding in the negative territory. Hence, any subsequent move up is more likely to confront stiff resistance near the $23.70-$23.75 area, or the 38.2% Fibonacci retracement level of the March-May rally. A sustained strength beyond the said barrier will suggest that the recent pullback from over a one-year high has run its course and shift the bias in favour of bullish traders.
The XAG/USD might then surpass the $24.00 round-figure mark and accelerate the momentum towards the next relevant hurdle near the $24.20-$24.25 region en route to the $24.50-$24.60 strong horizontal support breakpoint. The latter coincides with the 23.6% Fibo. level, above which a fresh bout of a short-covering should allow bullish traders to reclaim the $25.00 psychological mark. The upward trajectory could get extended towards the $25.30-$25.35 supply zone.
On the flip side, the 50% Fibo. level, just below the $23.00 round figure, now seems to protect the immediate downside ahead of the monthly low, around the $22.70-$22.65 region. Some follow-through selling will be seen as a fresh trigger for bearish traders and drag the XAG/USD below the 61.8% Fibo. level, around the $22.25 region, towards the $22.00 mark.
Technical Levels: Supports and Resistances
XAGUSD currently trading at 23.37 at the time of writing. Pair opened at 23.19 and is trading with a change of 0.78 % .
| Overview | Overview.1 | |
|---|---|---|
| 0 | Today last price | 23.37 |
| 1 | Today Daily Change | 0.18 |
| 2 | Today Daily Change % | 0.78 |
| 3 | Today daily open | 23.19 |
The pair is trading below its 20 Daily moving average @ 24.18, below its 50 Daily moving average @ 24.4 , above its 100 Daily moving average @ 23.35 and above its 200 Daily moving average @ 22.06
| Trends | Trends.1 | |
|---|---|---|
| 0 | Daily SMA20 | 24.18 |
| 1 | Daily SMA50 | 24.40 |
| 2 | Daily SMA100 | 23.35 |
| 3 | Daily SMA200 | 22.06 |
The previous day high was 23.34 while the previous day low was 22.93. The daily 38.2% Fib levels comes at 23.19, expected to provide support. Similarly, the daily 61.8% fib level is at 23.09, expected to provide support.
Note the levels of interest below:
- Pivot support is noted at 22.97, 22.74, 22.55
- Pivot resistance is noted at 23.38, 23.57, 23.8
| Levels | Levels.1 |
|---|---|
| Previous Daily High | 23.34 |
| Previous Daily Low | 22.93 |
| Previous Weekly High | 23.92 |
| Previous Weekly Low | 22.68 |
| Previous Monthly High | 26.09 |
| Previous Monthly Low | 23.57 |
| Daily Fibonacci 38.2% | 23.19 |
| Daily Fibonacci 61.8% | 23.09 |
| Daily Pivot Point S1 | 22.97 |
| Daily Pivot Point S2 | 22.74 |
| Daily Pivot Point S3 | 22.55 |
| Daily Pivot Point R1 | 23.38 |
| Daily Pivot Point R2 | 23.57 |
| Daily Pivot Point R3 | 23.80 |
[/s2If]
Nehcap Expert Advisor
The NEHCAP MT4 EA is high quality professional trading system geared to generate returns without using GRID or martingales. Each trade has strict risk per trade parameter. The pairs under management include EURUSD, GBPUSD, AUDCAD, AUDNZD,GBPAUD, EURAUD, EURCAD, CHFJPY and many more.
The system is trading live: LIVE ACCOUNT TRACKING
You can run it free. Apply for a free trial and track our account. Buy the system or use profit share mechanism to generate returns on your MT4.
Join Our Telegram Group
")


