#USDMXN @ 17.6740 rides on risk aversion and strong US data, marking two straight days of gains. (Pivot Orderbook analysis)
…
This is a premium post.
[s2If !current_user_can(access_s2member_level4)]Please register for FREE REGISTER to read full post below containing analysis. In case of any error or you think you are not able to read the full post below, please email us at support#nehcap.com [lwa][/s2If] [s2If current_user_can(access_s2member_level1)]
- USD/MXN rides on risk aversion and strong US data, marking two straight days of gains.
- Stellar US JOLTs report fuels potential Fed rate hike speculations, strengthening USD.
- Anticipated Mexico’s Business Confidence and US job data may sway the currency pair further.
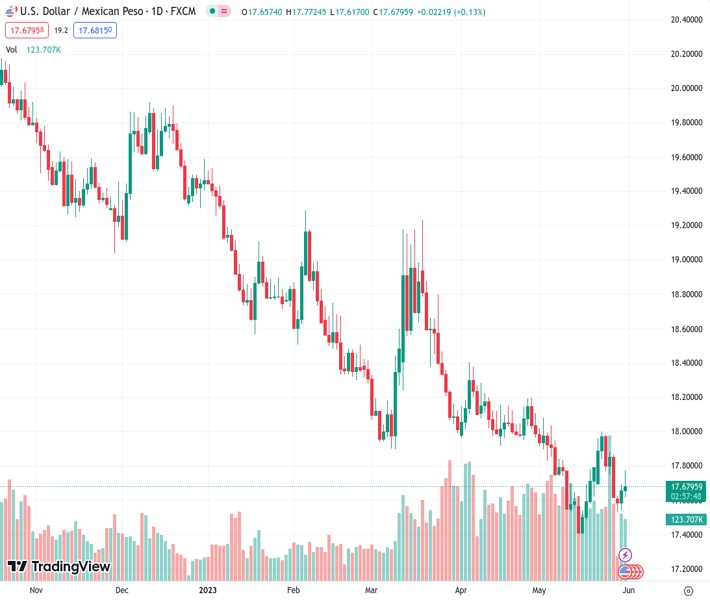
The pair currently trades last at 17.6740.
The previous day high was 17.6936 while the previous day low was 17.5411. The daily 38.2% Fib levels comes at 17.6354, expected to provide support. Similarly, the daily 61.8% fib level is at 17.5994, expected to provide support.
USD/MXN prints two consecutive days of gains, bouncing off the weekly lows of 17.5401, and reached the 17.7700 area as risk-aversion spurred outflows from the emerging market currency. Factors like China’s weak recovery, US debt-ceiling discussions, and solid data from the United States (US) weighed on the Mexican Peso (MXN). At the time of writing, the USD/MXN is trading at around 17.6860, above its opening price by 0.15%.
Wall Street extended its losses portraying a risk-off environment. Weaker than expected manufacturing PMI in China, US debt-ceiling woes, and upbeat US economic data underpinned the USD/MXN to new weekly highs of 17.7724.
The labor market in the United States is proving its resilience, as shown by data in the calendar. As revealed by the JOLTs report, job openings crushed estimates of 9.375M, which came at 10.1M in April, signaling the tightness of the labor market. Following the release, the USD/MXN jumped from around 17.60 toward the 17.7500 area. The reaction is attributed to speculations that the US Federal Reserve (Fed) could raise interest rates in the upcoming June meeting
That triggered a re-pricing towards a more hawkish Federal Reserve (Fed), with odds at 69.8%, for a 25 bps rate hike.
Federal Reserve speakers have begun crossing the wires, with the Vice-Chairman nominee by the US President Joe Biden, Philip Jefferson, saying that keeping rates unchanged. However, they should not be taken as a peak for the tightening cycle. Echoing some of his comments was Philadelphia Fed Patrick Harker, who commented that he’s on the camp of “skipping” a meeting and added that incoming data could change his point of view.
The agenda in Mexico will feature the Business Confidence for May after April’s numbers came to 52.6. Across the borders, the US economic docket will feature the ISM and S&P Global PMIs, jobs data with jobless claims, and the ADP Report.
The USD/MXN pair is downward biased. During the day, buyers tested the waters at the 20-day Exponential Moving Average (EMA), at 17.7511, before retracing from around that area, dropping below 17.7000 after Fed speakers’ remarks. For a bullish continuation, the USD/MXN buyers must claim the 20-day EMA and the April 2018 lows-turned-support at 17.9388 before challenging the 50-day EMA at 17.9483. Conversely, if USD/MXN slips below 17.60, a test of the YTD low of 17.4238 is likely.
Technical Levels: Supports and Resistances
USDMXN currently trading at 17.6988 at the time of writing. Pair opened at 17.6569 and is trading with a change of 0.24 % .
| Overview | Overview.1 | |
|---|---|---|
| 0 | Today last price | 17.6988 |
| 1 | Today Daily Change | 0.0419 |
| 2 | Today Daily Change % | 0.2400 |
| 3 | Today daily open | 17.6569 |
The pair remains strongly bearish on the daily time frame. It trades below the 20 SMA @ 17.7172, 50 SMA 17.9675, 100 SMA @ 18.2927 and 200 SMA @ 19.0207.
| Trends | Trends.1 | |
|---|---|---|
| 0 | Daily SMA20 | 17.7172 |
| 1 | Daily SMA50 | 17.9675 |
| 2 | Daily SMA100 | 18.2927 |
| 3 | Daily SMA200 | 19.0207 |
The previous day high was 17.6936 while the previous day low was 17.5411. The daily 38.2% Fib levels comes at 17.6354, expected to provide support. Similarly, the daily 61.8% fib level is at 17.5994, expected to provide support.
Note the levels of interest below:
- Pivot support is noted at 17.5675, 17.478, 17.415
- Pivot resistance is noted at 17.72, 17.7831, 17.8725
| Levels | Levels.1 |
|---|---|
| Previous Daily High | 17.6936 |
| Previous Daily Low | 17.5411 |
| Previous Weekly High | 17.9981 |
| Previous Weekly Low | 17.6165 |
| Previous Monthly High | 18.4018 |
| Previous Monthly Low | 17.9329 |
| Daily Fibonacci 38.2% | 17.6354 |
| Daily Fibonacci 61.8% | 17.5994 |
| Daily Pivot Point S1 | 17.5675 |
| Daily Pivot Point S2 | 17.4780 |
| Daily Pivot Point S3 | 17.4150 |
| Daily Pivot Point R1 | 17.7200 |
| Daily Pivot Point R2 | 17.7831 |
| Daily Pivot Point R3 | 17.8725 |
[/s2If]
Nehcap Expert Advisor
The NEHCAP MT4 EA is high quality professional trading system geared to generate returns without using GRID or martingales. Each trade has strict risk per trade parameter. The pairs under management include EURUSD, GBPUSD, AUDCAD, AUDNZD,GBPAUD, EURAUD, EURCAD, CHFJPY and many more.
The system is trading live: LIVE ACCOUNT TRACKING
You can run it free. Apply for a free trial and track our account. Buy the system or use profit share mechanism to generate returns on your MT4.
Join Our Telegram Group
")


