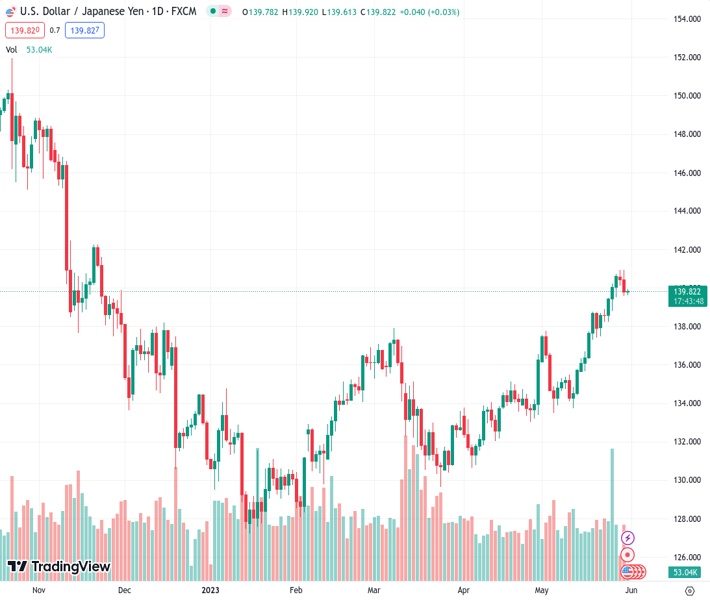
#USDJPY @ 139.824 remains sidelined after reversing from six-month high in the last two days. (Pivot Orderbook analysis)
…
This is a premium post.
[s2If !current_user_can(access_s2member_level4)]Please register for FREE REGISTER to read full post below containing analysis. In case of any error or you think you are not able to read the full post below, please email us at support#nehcap.com [lwa][/s2If] [s2If current_user_can(access_s2member_level1)]
- USD/JPY remains sidelined after reversing from six-month high in the last two days.
- BoJ’s Kuroda cites inflation woes but defends easy monetary policy.
- Fears of US default, anxiety ahead of key employment signals weigh on sentiment, put a floor under US Dollar.
- Yen sellers need validation from US House, Treasury bond yields.
The pair currently trades last at 139.824.
The previous day high was 140.93 while the previous day low was 139.57. The daily 38.2% Fib levels comes at 140.09, expected to provide resistance. Similarly, the daily 61.8% fib level is at 140.41, expected to provide resistance.
USD/JPY struggles to portray the market’s slightly downbeat sentiment, as well as hesitates to justify the Bank of Japan (BoJ) Governor Kazuo Ueda’s comments, amid an unimpressive Wednesday morning in Europe. That said, the Yen pair treads water around 139.75 by the press time while pausing the two-day losing streak from the highest levels since November 2022.
While portraying the mood, the S&P500 Futures remain indecisive, mildly offered around 4,220 by the press time, after a mixed Wall Street close whereas the US Treasury bond yields stay depressed of late. Furthermore, the US Dollar Index (DXY) picks up bids to around 104.25, after snapping a six-day uptrend near the highest levels in 10 weeks.
Earlier in the day, BoJ Governor Kazuo Ueda highlighted inflation woes in the nation and renewed hawkish bias for the Japanese central bank. However, the policymaker also said, “Whether inflation is caused by demand or supply has very important implications for monetary policymaking.” On the same line, Japanese data were also mixed for April as Industrial Production improved on YoY but eased on MoM whereas the Large Retailer Sales rose heavily during the said month.
Elsewhere, mixed US data joins fears of economic slowdown, backed by Richmond Fed Thomas Barkin’s comments, to underpin the markets’ cautious mood and weigh on the USD/JPY prices. On the same line could be the anxiety ahead of the key data/events as the US Republicans show readiness to vote down the agreement to avoid the debt-ceiling expiration. Additionally, the hawkish Fed bets and fears of economic slowdown, should the US default on its debt payment, also weigh on the market sentiment and USD/JPY price.
However, the DXY cheers the market’s optimism that the US policymakers will anyhow avoid the default and will enable the Federal Reserve to keep the rates higher for longer.
Looking forward, the House voting on the US debt ceiling deal will be crucial for immediate direction. Also important to watch is the US JOLTS Job Openings for April, expected 9.375M versus 9.59M prior, as well as the Chicago Purchasing Managers’ Index for May, likely to fall to 47.0 from 48.6.
A daily closing below the three-week-old previous support line, now immediate resistance near 140.80, directs USD/JPY bears toward the 10-DMA support of 139.40.
Technical Levels: Supports and Resistances
USDJPY currently trading at 139.77 at the time of writing. Pair opened at 139.79 and is trading with a change of -0.01% % .
| Overview | Overview.1 | |
|---|---|---|
| 0 | Today last price | 139.77 |
| 1 | Today Daily Change | -0.02 |
| 2 | Today Daily Change % | -0.01% |
| 3 | Today daily open | 139.79 |
The pair remains strongly bullish on the daily timeframe. It trades above its 20 SMA @ 137.15, 50 SMA 134.81, 100 SMA @ 133.67 and 200 SMA @ 137.26.
| Trends | Trends.1 | |
|---|---|---|
| 0 | Daily SMA20 | 137.15 |
| 1 | Daily SMA50 | 134.81 |
| 2 | Daily SMA100 | 133.67 |
| 3 | Daily SMA200 | 137.26 |
The previous day high was 140.93 while the previous day low was 139.57. The daily 38.2% Fib levels comes at 140.09, expected to provide resistance. Similarly, the daily 61.8% fib level is at 140.41, expected to provide resistance.
Note the levels of interest below:
- Pivot support is noted at 139.26, 138.74, 137.9
- Pivot resistance is noted at 140.62, 141.46, 141.98
| Levels | Levels.1 |
|---|---|
| Previous Daily High | 140.93 |
| Previous Daily Low | 139.57 |
| Previous Weekly High | 140.72 |
| Previous Weekly Low | 137.49 |
| Previous Monthly High | 136.56 |
| Previous Monthly Low | 130.63 |
| Daily Fibonacci 38.2% | 140.09 |
| Daily Fibonacci 61.8% | 140.41 |
| Daily Pivot Point S1 | 139.26 |
| Daily Pivot Point S2 | 138.74 |
| Daily Pivot Point S3 | 137.90 |
| Daily Pivot Point R1 | 140.62 |
| Daily Pivot Point R2 | 141.46 |
| Daily Pivot Point R3 | 141.98 |
[/s2If]
Nehcap Expert Advisor
The NEHCAP MT4 EA is high quality professional trading system geared to generate returns without using GRID or martingales. Each trade has strict risk per trade parameter. The pairs under management include EURUSD, GBPUSD, AUDCAD, AUDNZD,GBPAUD, EURAUD, EURCAD, CHFJPY and many more.
The system is trading live: LIVE ACCOUNT TRACKING
You can run it free. Apply for a free trial and track our account. Buy the system or use profit share mechanism to generate returns on your MT4.
Join Our Telegram Group
")


