#USDJPY @ 139.589 drifts lower for the third straight day and is pressured by a combination of factors. (Pivot Orderbook analysis)
…
This is a premium post.
[s2If !current_user_can(access_s2member_level4)]Please register for FREE REGISTER to read full post below containing analysis. In case of any error or you think you are not able to read the full post below, please email us at support#nehcap.com [lwa][/s2If] [s2If current_user_can(access_s2member_level1)]
- USD/JPY drifts lower for the third straight day and is pressured by a combination of factors.
- The risk-off mood, along with the intervention warning, boosts the JPY and weighs on the pair.
- The emergence of fresh USD buying could lend some support and help limit deeper losses.
The pair currently trades last at 139.589.
The previous day high was 140.93 while the previous day low was 139.57. The daily 38.2% Fib levels comes at 140.09, expected to provide resistance. Similarly, the daily 61.8% fib level is at 140.41, expected to provide resistance.
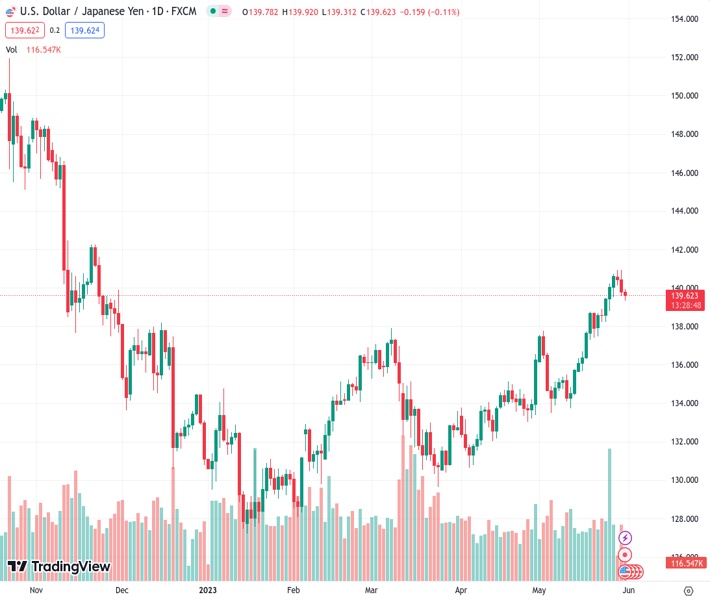
The USD/JPY pair extends the overnight retracement slide from the vicinity of the 141.00 mark, or a six-month high and remains under some follow-through selling on Wednesday. The pair maintains its offered tone through the early European session and currently trade around mid-139.00s, down over 0.20% for the day.
A combination of factors provides a goodish lift to the Japanese Yen (JPY), which, in turn, is seem exerting downward pressure on the USD/JPY pair for the third successive day. The disappointing release of the official Chinese PMI prints for May adds to worries about a global economic slowdown and tempers investors’ appetite for riskier assets. This, along with the prospect of Japanese authorities intervening in the markets, boosts demand for the safe-haven JPY and contributes to the offered tone around the major.
In fact, Japan’s Vice Finance Minister for international affairs, Masato Kanda, hinted that authorities may act to curd the sinking Yen, saying that they will closely watch currency market moves and respond appropriately as needed. He added that they won’t rule out every option available. Apart from this, the ongoing slide in the US Treasury bond yields results in the narrowing of the US-Japan rate differential and further benefits the JPY. That said, a more dovish stance adopted by the Bank of Japan (BoJ) might cap the JPY.
Apart from this, the emergence of fresh US Dollar (USD) buying should help limit losses for the USD/JPY pair. In fact, the USD Index (DXY), which tracks the Greenback against a basket of currencies, climbs back closer to its highest level since mid-March touched on Tuesday and remains supported by hawkish Federal Reserve (Fed) expectations. Markets seem convinced that the US central bank will keep interest rates higher for longer and have been pricing in a greater chance of another 25 bps lift-off at the June FOMC meeting.
This, in turn, warrants caution before placing aggressive bearish bets around the USD/JPY pair. Market participants now look forward to the US economic docket, featuring the Chicago PMI and JOLTS Job Openings data. This, along with speeches by influential FOMC members and the US bond yields, will drive the USD demand. Apart from this, the broader risk sentiment should provide some impetus to the USD/JPY pair and allow traders to grab short-term opportunities.
Technical Levels: Supports and Resistances
USDJPY currently trading at 139.48 at the time of writing. Pair opened at 139.79 and is trading with a change of -0.22 % .
| Overview | Overview.1 | |
|---|---|---|
| 0 | Today last price | 139.48 |
| 1 | Today Daily Change | -0.31 |
| 2 | Today Daily Change % | -0.22 |
| 3 | Today daily open | 139.79 |
The pair remains strongly bullish on the daily timeframe. It trades above its 20 SMA @ 137.15, 50 SMA 134.81, 100 SMA @ 133.67 and 200 SMA @ 137.26.
| Trends | Trends.1 | |
|---|---|---|
| 0 | Daily SMA20 | 137.15 |
| 1 | Daily SMA50 | 134.81 |
| 2 | Daily SMA100 | 133.67 |
| 3 | Daily SMA200 | 137.26 |
The previous day high was 140.93 while the previous day low was 139.57. The daily 38.2% Fib levels comes at 140.09, expected to provide resistance. Similarly, the daily 61.8% fib level is at 140.41, expected to provide resistance.
Note the levels of interest below:
- Pivot support is noted at 139.26, 138.74, 137.9
- Pivot resistance is noted at 140.62, 141.46, 141.98
| Levels | Levels.1 |
|---|---|
| Previous Daily High | 140.93 |
| Previous Daily Low | 139.57 |
| Previous Weekly High | 140.72 |
| Previous Weekly Low | 137.49 |
| Previous Monthly High | 136.56 |
| Previous Monthly Low | 130.63 |
| Daily Fibonacci 38.2% | 140.09 |
| Daily Fibonacci 61.8% | 140.41 |
| Daily Pivot Point S1 | 139.26 |
| Daily Pivot Point S2 | 138.74 |
| Daily Pivot Point S3 | 137.90 |
| Daily Pivot Point R1 | 140.62 |
| Daily Pivot Point R2 | 141.46 |
| Daily Pivot Point R3 | 141.98 |
[/s2If]
Nehcap Expert Advisor
The NEHCAP MT4 EA is high quality professional trading system geared to generate returns without using GRID or martingales. Each trade has strict risk per trade parameter. The pairs under management include EURUSD, GBPUSD, AUDCAD, AUDNZD,GBPAUD, EURAUD, EURCAD, CHFJPY and many more.
The system is trading live: LIVE ACCOUNT TRACKING
You can run it free. Apply for a free trial and track our account. Buy the system or use profit share mechanism to generate returns on your MT4.
Join Our Telegram Group
")


