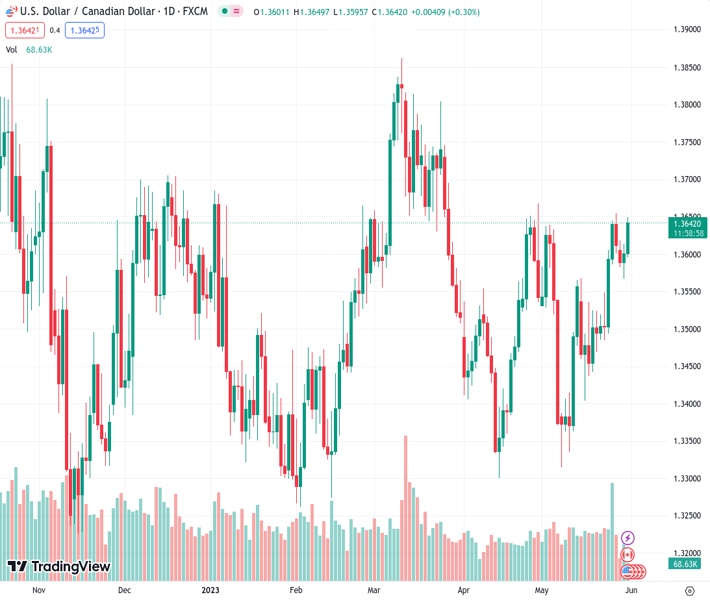
#USDCAD @ 1.36421 gains traction for the second straight day and draws support from a combination of factors. (Pivot Orderbook analysis)
…
This is a premium post.
[s2If !current_user_can(access_s2member_level4)]Please register for FREE REGISTER to read full post below containing analysis. In case of any error or you think you are not able to read the full post below, please email us at support#nehcap.com [lwa][/s2If] [s2If current_user_can(access_s2member_level1)]
- USD/CAD gains traction for the second straight day and draws support from a combination of factors.
- Bearish Oil prices undermine the Loonie and lend support amid the emergence of fresh USD buying.
- Traders now look forward to the Canadian Q1 GDP print and the US macro data for a fresh impetus.
The pair currently trades last at 1.36421.
The previous day high was 1.3613 while the previous day low was 1.3567. The daily 38.2% Fib levels comes at 1.3596, expected to provide support. Similarly, the daily 61.8% fib level is at 1.3585, expected to provide support.
The USD/CAD pair builds on the overnight bounce from the 1.3565 area, or a multi-day low and gains some follow-through traction for the second successive day on Wednesday. The pair maintains its bid tone through the early part of the European session and currently trades near the top end of its daily range, around the 1.3645 region.
A combination of factors assists the US Dollar (USD) to attract fresh buyers, which, in turn, acts as a tailwind for the USD/CAD pair. Investors seem convinced that the Federal Reserve (Fed) will keep interest rates higher for longer and have been pricing in a greater chance of another 25 bps lift-off at the June FOMC policy meeting. the bets were lifted by the US PCE Price Index data on Friday, which showed that inflation remains sticky. This, along with the risk-off impulse, further benefits the safe-haven buck.
The market sentiment remains fragile amid worries about slowing economic growth, particularly in China. The National Bureau of Statistics (NBS) reported this Wednesday that China’s factory activity shrank faster than expected in May. Moreover, business activity in China’s service expanded at the slowest pace in four months. This, along with concerns about the worsening US-China ties overshadow the optimism over raising the US debt ceiling and temper investors’ appetite for perceived riskier assets.
A patchy economic recovery in the world’s second-largest economy, meanwhile, raises concerns about fuel demand from the top oil importer China. This, in turn, drags Crude Oil prices to a nearly four-week low, which undermines the commodity-linked Loonie and provides an additional boost to the USD/CAD pair. Spot prices move well within the striking distance of the monthly peak touched last week as traders now look to important macro releases from Canada and the US for some meaningful impetus.
Wednesday’s economic docket features the release of the Canadian Q1 GDP report, along with the Chicago PMI and JOLTS Job Openings data from the US later during the early North American session. Apart from this, speeches by influential FOMC members and the broader risk sentiment will drive the USD demand. Traders will further take cues from Oil price dynamics to grab short-term opportunities around the USD/CAD pair. Nevertheless, the aforementioned fundamental backdrop favours bullish traders.
Technical Levels: Supports and Resistances
USDCAD currently trading at 1.3644 at the time of writing. Pair opened at 1.3602 and is trading with a change of 0.31 % .
| Overview | Overview.1 | |
|---|---|---|
| 0 | Today last price | 1.3644 |
| 1 | Today Daily Change | 0.0042 |
| 2 | Today Daily Change % | 0.3100 |
| 3 | Today daily open | 1.3602 |
The pair remains strongly bullish on the daily timeframe. It trades above its 20 SMA @ 1.3509, 50 SMA 1.3521, 100 SMA @ 1.3515 and 200 SMA @ 1.3499.
| Trends | Trends.1 | |
|---|---|---|
| 0 | Daily SMA20 | 1.3509 |
| 1 | Daily SMA50 | 1.3521 |
| 2 | Daily SMA100 | 1.3515 |
| 3 | Daily SMA200 | 1.3499 |
The previous day high was 1.3613 while the previous day low was 1.3567. The daily 38.2% Fib levels comes at 1.3596, expected to provide support. Similarly, the daily 61.8% fib level is at 1.3585, expected to provide support.
Note the levels of interest below:
- Pivot support is noted at 1.3575, 1.3548, 1.3529
- Pivot resistance is noted at 1.3621, 1.364, 1.3667
| Levels | Levels.1 |
|---|---|
| Previous Daily High | 1.3613 |
| Previous Daily Low | 1.3567 |
| Previous Weekly High | 1.3655 |
| Previous Weekly Low | 1.3485 |
| Previous Monthly High | 1.3668 |
| Previous Monthly Low | 1.3301 |
| Daily Fibonacci 38.2% | 1.3596 |
| Daily Fibonacci 61.8% | 1.3585 |
| Daily Pivot Point S1 | 1.3575 |
| Daily Pivot Point S2 | 1.3548 |
| Daily Pivot Point S3 | 1.3529 |
| Daily Pivot Point R1 | 1.3621 |
| Daily Pivot Point R2 | 1.3640 |
| Daily Pivot Point R3 | 1.3667 |
[/s2If]
Nehcap Expert Advisor
The NEHCAP MT4 EA is high quality professional trading system geared to generate returns without using GRID or martingales. Each trade has strict risk per trade parameter. The pairs under management include EURUSD, GBPUSD, AUDCAD, AUDNZD,GBPAUD, EURAUD, EURCAD, CHFJPY and many more.
The system is trading live: LIVE ACCOUNT TRACKING
You can run it free. Apply for a free trial and track our account. Buy the system or use profit share mechanism to generate returns on your MT4.
Join Our Telegram Group
")


