The oil price is gauged intermediate support around $67.50, however, the downside seems favored as Fed to raise rates further. (Pivot Orderbook analysis)
…
This is a premium post.
[s2If !current_user_can(access_s2member_level4)]Please register for FREE REGISTER to read full post below containing analysis. In case of any error or you think you are not able to read the full post below, please email us at support#nehcap.com [lwa][/s2If] [s2If current_user_can(access_s2member_level1)]
- The oil price is gauged intermediate support around $67.50, however, the downside seems favored as Fed to raise rates further.
- A sharp decline in China’s factory activity indicated a bleak outlook for oil demand.
- OPEC meeting will remain in focus as oil-producing nations are expected to announce more supply cuts to support energy prices.
The pair currently trades last at 67.77.
The previous day high was 73.39 while the previous day low was 69.08. The daily 38.2% Fib levels comes at 70.73, expected to provide resistance. Similarly, the daily 61.8% fib level is at 71.74, expected to provide resistance.
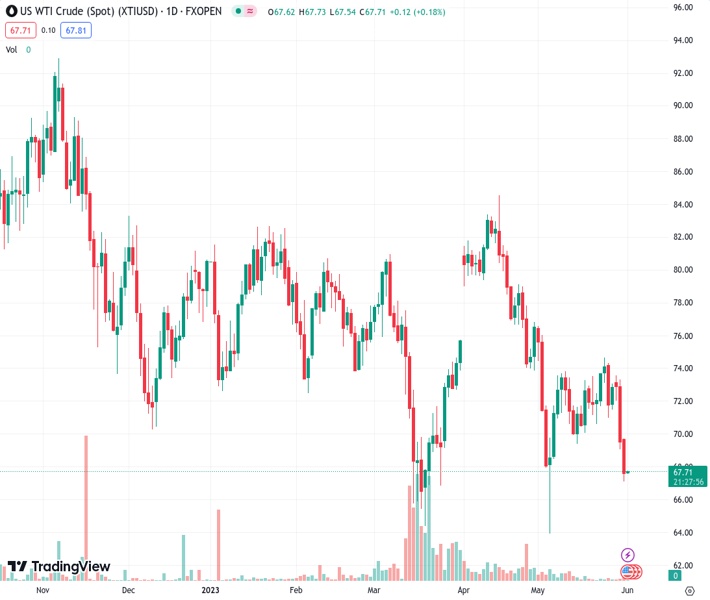
West Texas Intermediate (WTI), futures on NYMEX, have gauged intermediate support around $67.50 in the Asian session. The pullback move in the oil price to near $69.50 was capitalized by the market participants as a selling opportunity amid multiple bearish catalysts.
As United States consumer spending turned out to be resilient in April and their labor market conditions are still healthy, it seems that the Federal Reserve (Fed) is preparing for a fresh rate hike despite announcing that more rate hikes are less certain amid tight credit conditions by the US regional banks. Further monetary policy tightening by the Fed would deepen hopes of a recession in the US economy, which will have a significant impact on the oil demand.
On Wednesday, a sharp decline in China’s factory activity displayed a bleak outlook for oil demand. China’s National Bureau of Statistics (NBS) reported Manufacturing PMI at 48.8, lower than the estimates of 49.4 and the former release of 49.2. A figure below 50.0 is itself considered a contraction. It is worth mentioning that China is the largest importer of oil in the world and weak economic activities in China would have a significant impact on the oil price.
Meanwhile, the US Dollar Index (DXY) has found some cushion near 104.20 ahead of the US Employment data, which will provide guidance about the Fed’s interest rate policy.
Later this weekend, the OPEC meeting will remain in focus as oil-producing nations are expected to announce more supply cuts to support energy prices. Tensions between Russia and Saudi Arabia have remained elevated as the former has disrespected the pledge and pumping cheap oil into the global economy. The notion of production cuts by OPEC+ could be faded if Moscow continues to deliver oil at cheaper rates.
Regarding oil outlook, economists at Rabobank cited “Right now, we see OPEC+ staying the course and continuing the April cuts of 1.6m bpd. The surprise April cut boosted prices by $5-$7 for about three weeks. A second cut would display their fears more openly and indicates greater weakness; we construe a second cut as a bearish signal unless the cuts are extremely substantive.”
Going forward, oil inventory data for the week ending May 26 by the US Energy Information Administration (EIA) will be keenly watched. Investors should note that US American Petroleum Institute (API) reported a build-up of oil stockpiles on Tuesday by 5.202M barrels.
Technical Levels: Supports and Resistances
XTIUSD currently trading at 67.77 at the time of writing. Pair opened at 69.58 and is trading with a change of -2.6 % .
| Overview | Overview.1 | |
|---|---|---|
| 0 | Today last price | 67.77 |
| 1 | Today Daily Change | -1.81 |
| 2 | Today Daily Change % | -2.60 |
| 3 | Today daily open | 69.58 |
The pair remains strongly bearish on the daily time frame. It trades below the 20 SMA @ 71.71, 50 SMA 74.76, 100 SMA @ 75.93 and 200 SMA @ 79.43.
| Trends | Trends.1 | |
|---|---|---|
| 0 | Daily SMA20 | 71.71 |
| 1 | Daily SMA50 | 74.76 |
| 2 | Daily SMA100 | 75.93 |
| 3 | Daily SMA200 | 79.43 |
The previous day high was 73.39 while the previous day low was 69.08. The daily 38.2% Fib levels comes at 70.73, expected to provide resistance. Similarly, the daily 61.8% fib level is at 71.74, expected to provide resistance.
Note the levels of interest below:
- Pivot support is noted at 67.98, 66.37, 63.67
- Pivot resistance is noted at 72.29, 74.99, 76.6
| Levels | Levels.1 |
|---|---|
| Previous Daily High | 73.39 |
| Previous Daily Low | 69.08 |
| Previous Weekly High | 74.70 |
| Previous Weekly Low | 70.66 |
| Previous Monthly High | 83.40 |
| Previous Monthly Low | 73.88 |
| Daily Fibonacci 38.2% | 70.73 |
| Daily Fibonacci 61.8% | 71.74 |
| Daily Pivot Point S1 | 67.98 |
| Daily Pivot Point S2 | 66.37 |
| Daily Pivot Point S3 | 63.67 |
| Daily Pivot Point R1 | 72.29 |
| Daily Pivot Point R2 | 74.99 |
| Daily Pivot Point R3 | 76.60 |
[/s2If]
Nehcap Expert Advisor
The NEHCAP MT4 EA is high quality professional trading system geared to generate returns without using GRID or martingales. Each trade has strict risk per trade parameter. The pairs under management include EURUSD, GBPUSD, AUDCAD, AUDNZD,GBPAUD, EURAUD, EURCAD, CHFJPY and many more.
The system is trading live: LIVE ACCOUNT TRACKING
You can run it free. Apply for a free trial and track our account. Buy the system or use profit share mechanism to generate returns on your MT4.
Join Our Telegram Group
")


