The oil price is consolidating above $69.00 ahead of oil inventory data by the US API. (Pivot Orderbook analysis)
…
This is a premium post.
[s2If !current_user_can(access_s2member_level4)]Please register for FREE REGISTER to read full post below containing analysis. In case of any error or you think you are not able to read the full post below, please email us at support#nehcap.com [lwa][/s2If] [s2If current_user_can(access_s2member_level1)]
- The oil price is consolidating above $69.00 ahead of oil inventory data by the US API.
- Resilient US consumer spending and decent labor market conditions are bolstering chances of one more rate hike by the Fed.
- Tensions between Russia and Saudi Arabia have remained higher as the former is consistently pumping cheaper oil into the global economy.
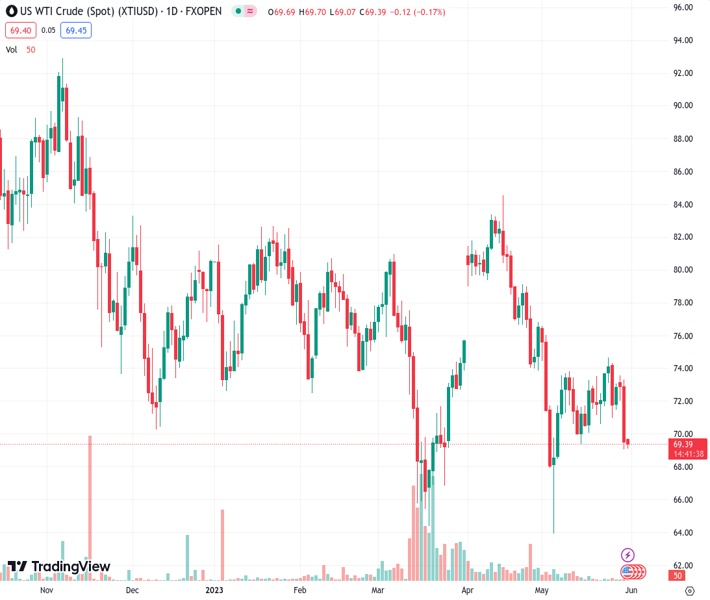
The pair currently trades last at 69.47.
The previous day high was 73.39 while the previous day low was 69.08. The daily 38.2% Fib levels comes at 70.73, expected to provide resistance. Similarly, the daily 61.8% fib level is at 71.74, expected to provide resistance.
West Texas Intermediate (WTI), futures on NYMEX, are oscillating above 69.00 in the early European session. The oil price is expected to extend its losses as fears of a recession in the global economy are skyrocketing.
The economic outlook for the United States economy is still in bad shape as interest rates by the Federal Reserve (Fed) are above 5%. And, now rising expectations of one more interest rate hike in June’s monetary policy meeting, considering resilient consumer spending and decent labor market conditions, are bolstering fears of a recession. The German economy has already slipped into recession after reporting a contraction in Gross Domestic Product (GDP) figures consecutively for two quarters.
Meanwhile, contracting Chinese factory activity has also weighed on oil prices. In Asia, China’s National Bureau of Statistics (NBS) reported Manufacturing PMI at 48.8, lower than the estimates of 49.4 and the former release of 49.2. Investors should not that a figure below 50.0 is itself considered a contraction. It is worth mentioning that China is the largest importer of oil in the world and weak economic activities in China would have a significant impact on the oil price.
Later this week, OPEC’s meeting will be keenly focused as production cuts would be discussed to support energy prices. Tensions between Russia and Saudi Arabia have remained higher as the former is consistently pumping cheaper oil into the global economy, undermining efforts made by the latter to bolster energy prices.
The impact of cutting overall production further by OPEC+ members excluding Russia could be nullified as Russia is not committed to keeping the pledge anymore.
On late Wednesday, investors will keep an eye on the release of oil inventories for the week ending May 26 by the US American Petroleum Institute (API).
Technical Levels: Supports and Resistances
XTIUSD currently trading at 69.47 at the time of writing. Pair opened at 69.58 and is trading with a change of -0.16 % .
| Overview | Overview.1 | |
|---|---|---|
| 0 | Today last price | 69.47 |
| 1 | Today Daily Change | -0.11 |
| 2 | Today Daily Change % | -0.16 |
| 3 | Today daily open | 69.58 |
The pair remains strongly bearish on the daily time frame. It trades below the 20 SMA @ 71.71, 50 SMA 74.76, 100 SMA @ 75.93 and 200 SMA @ 79.43.
| Trends | Trends.1 | |
|---|---|---|
| 0 | Daily SMA20 | 71.71 |
| 1 | Daily SMA50 | 74.76 |
| 2 | Daily SMA100 | 75.93 |
| 3 | Daily SMA200 | 79.43 |
The previous day high was 73.39 while the previous day low was 69.08. The daily 38.2% Fib levels comes at 70.73, expected to provide resistance. Similarly, the daily 61.8% fib level is at 71.74, expected to provide resistance.
Note the levels of interest below:
- Pivot support is noted at 67.98, 66.37, 63.67
- Pivot resistance is noted at 72.29, 74.99, 76.6
| Levels | Levels.1 |
|---|---|
| Previous Daily High | 73.39 |
| Previous Daily Low | 69.08 |
| Previous Weekly High | 74.70 |
| Previous Weekly Low | 70.66 |
| Previous Monthly High | 83.40 |
| Previous Monthly Low | 73.88 |
| Daily Fibonacci 38.2% | 70.73 |
| Daily Fibonacci 61.8% | 71.74 |
| Daily Pivot Point S1 | 67.98 |
| Daily Pivot Point S2 | 66.37 |
| Daily Pivot Point S3 | 63.67 |
| Daily Pivot Point R1 | 72.29 |
| Daily Pivot Point R2 | 74.99 |
| Daily Pivot Point R3 | 76.60 |
[/s2If]
Nehcap Expert Advisor
The NEHCAP MT4 EA is high quality professional trading system geared to generate returns without using GRID or martingales. Each trade has strict risk per trade parameter. The pairs under management include EURUSD, GBPUSD, AUDCAD, AUDNZD,GBPAUD, EURAUD, EURCAD, CHFJPY and many more.
The system is trading live: LIVE ACCOUNT TRACKING
You can run it free. Apply for a free trial and track our account. Buy the system or use profit share mechanism to generate returns on your MT4.
Join Our Telegram Group
")


