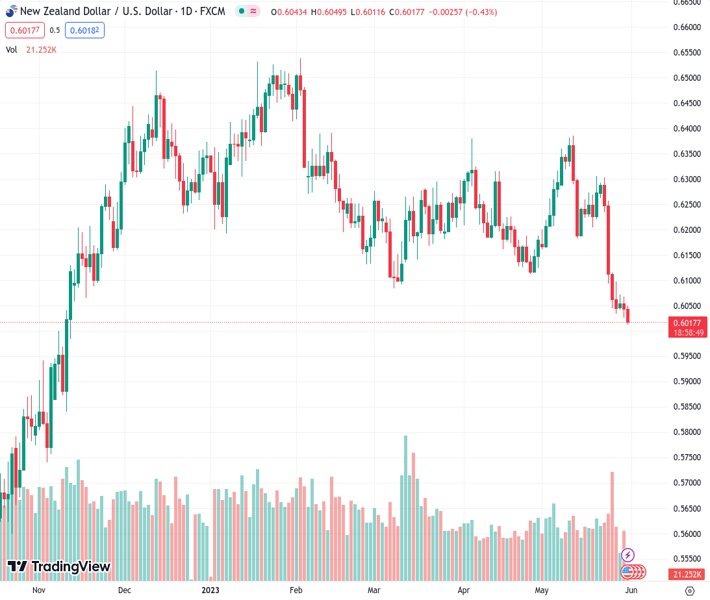
#NZDUSD @ 0.60159 has sharply dived below 0.6020 amid mixed China’s Official PMI data. (Pivot Orderbook analysis)
…
This is a premium post.
[s2If !current_user_can(access_s2member_level4)]Please register for FREE REGISTER to read full post below containing analysis. In case of any error or you think you are not able to read the full post below, please email us at support#nehcap.com [lwa][/s2If] [s2If current_user_can(access_s2member_level1)]
- NZD/USD has sharply dived below 0.6020 amid mixed China’s Official PMI data.
- China’s Manufacturing PMI at 48.8, lower than the estimates of 49.4 while Non-Manufacturing PMI jumped to 54.5 vs. 50.7.
- NZD/USD has formed a Bullish Divergence which indicates exhaustion in the downside momentum.
The pair currently trades last at 0.60159.
The previous day high was 0.6067 while the previous day low was 0.6025. The daily 38.2% Fib levels comes at 0.6041, expected to provide resistance. Similarly, the daily 61.8% fib level is at 0.6051, expected to provide resistance.
The NZD/USD pair has tumbled to near 0.6016 after the release of mixed China’s official PMI data (May). China’s National Bureau of Statistics (NBS) has reported Manufacturing PMI at 48.8, lower than the estimates of 49.4 and the former release of 49.2. While Non-Manufacturing PMI jumped to 54.5 from the consensus of 50.7 but remained lower than the former figure of 56.4.
The US Dollar Index (DXY) has extended its retreat move further below 104.04 as an approval of a raise in the US debt-ceiling has weakened its appeal. Going forward, the USD Index will be guided by the release of the US Automatic Data Processing (ADP) Employment Change data.
Going forward, New Zealand Dollar will continue its action ahead of the release of the Caixin Manufacturing PMI data (May). As per the consensus, the economic data is seen steady at 49.5. It is worth noting that New Zealand is one of the leading trading partners of China and a stagnant China’s factory performance could impact the New Zealand Dollar.
NZD/USD has formed a Bullish Divergence on a two-hour scale, which indicates exhaustion in the downside momentum. The Kiwi asset was consistently making lower lows while the momentum oscillator Relative Strength Index (RSI) (14) made higher lows. The bullish divergence would get triggered after a decisive break above the crucial resistance of 0.6070.
The 20-period Exponential Moving Average (EMA) at 0.6048 is still acting as a barricade for the New Zealand Dollar bulls.
A confident break above the immediate resistance of 0.6070 will drive the Kiwi asset toward the horizontal resistance plotted from May 25 high at 0.6110 followed by May 01 low at 0.6160.
On the flip side, a downside move below the intraday low at 0.6015 will expose the asset for a fresh six-month low toward 11 November 2022 low at 0.5984. A slippage below the latter would expose the asset toward 02 November 2022 high at 0.5941.
Technical Levels: Supports and Resistances
NZDUSD currently trading at 0.6037 at the time of writing. Pair opened at 0.6044 and is trading with a change of -0.12 % .
| Overview | Overview.1 | |
|---|---|---|
| 0 | Today last price | 0.6037 |
| 1 | Today Daily Change | -0.0007 |
| 2 | Today Daily Change % | -0.1200 |
| 3 | Today daily open | 0.6044 |
The pair remains strongly bearish on the daily time frame. It trades below the 20 SMA @ 0.6213, 50 SMA 0.6214, 100 SMA @ 0.626 and 200 SMA @ 0.6152.
| Trends | Trends.1 | |
|---|---|---|
| 0 | Daily SMA20 | 0.6213 |
| 1 | Daily SMA50 | 0.6214 |
| 2 | Daily SMA100 | 0.6260 |
| 3 | Daily SMA200 | 0.6152 |
The previous day high was 0.6067 while the previous day low was 0.6025. The daily 38.2% Fib levels comes at 0.6041, expected to provide resistance. Similarly, the daily 61.8% fib level is at 0.6051, expected to provide resistance.
Note the levels of interest below:
- Pivot support is noted at 0.6024, 0.6003, 0.5982
- Pivot resistance is noted at 0.6066, 0.6087, 0.6108
| Levels | Levels.1 |
|---|---|
| Previous Daily High | 0.6067 |
| Previous Daily Low | 0.6025 |
| Previous Weekly High | 0.6303 |
| Previous Weekly Low | 0.6032 |
| Previous Monthly High | 0.6389 |
| Previous Monthly Low | 0.6111 |
| Daily Fibonacci 38.2% | 0.6041 |
| Daily Fibonacci 61.8% | 0.6051 |
| Daily Pivot Point S1 | 0.6024 |
| Daily Pivot Point S2 | 0.6003 |
| Daily Pivot Point S3 | 0.5982 |
| Daily Pivot Point R1 | 0.6066 |
| Daily Pivot Point R2 | 0.6087 |
| Daily Pivot Point R3 | 0.6108 |
[/s2If]
Nehcap Expert Advisor
The NEHCAP MT4 EA is high quality professional trading system geared to generate returns without using GRID or martingales. Each trade has strict risk per trade parameter. The pairs under management include EURUSD, GBPUSD, AUDCAD, AUDNZD,GBPAUD, EURAUD, EURCAD, CHFJPY and many more.
The system is trading live: LIVE ACCOUNT TRACKING
You can run it free. Apply for a free trial and track our account. Buy the system or use profit share mechanism to generate returns on your MT4.
Join Our Telegram Group
")


