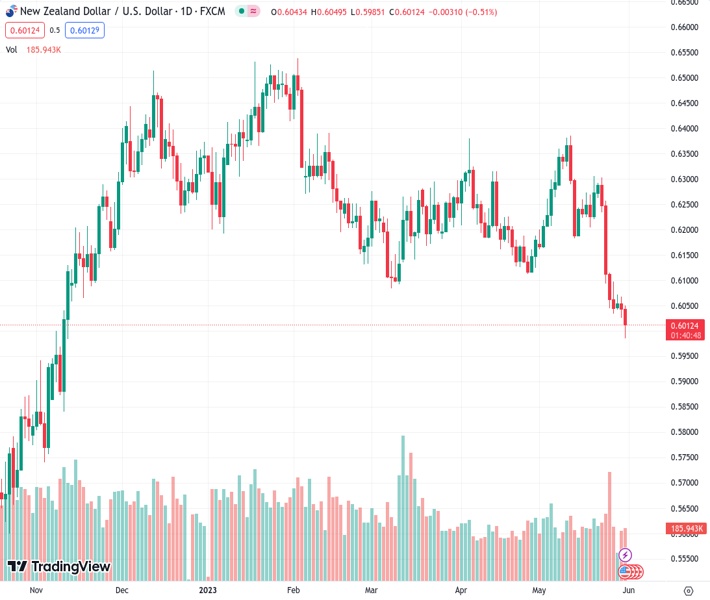
#NZDUSD @ 0.60133 lost over 80 pips as the US Dollar benefits from a sour market mood. (Pivot Orderbook analysis)
…
This is a premium post.
[s2If !current_user_can(access_s2member_level4)]Please register for FREE REGISTER to read full post below containing analysis. In case of any error or you think you are not able to read the full post below, please email us at support#nehcap.com [lwa][/s2If] [s2If current_user_can(access_s2member_level1)]
- NZD/USD lost over 80 pips as the US Dollar benefits from a sour market mood.
- Uncertainty over the passing of the debt-ceiling bill and the US labor market outlook contribute to a negative market sentiment.
- Dovish Fed speakers helped the pair erase part of the daily losses.
The pair currently trades last at 0.60133.
The previous day high was 0.6067 while the previous day low was 0.6025. The daily 38.2% Fib levels comes at 0.6041, expected to provide resistance. Similarly, the daily 61.8% fib level is at 0.6051, expected to provide resistance.
The NZD/USD has reached its lowest levels in several months due to the increasing strength of the US Dollar. This is primarily driven by uncertainties surrounding the latest US data from the US and concerns about the passage of the debt-limit bill, which is facing resistance in both chambers of the US Congress. In addition Patrick Harker from the Philadelphia Federal Reserve (Fed), commented that the Fed doesn’t have to hike at every meeting and seems to be limiting the Greenback’s gains. On the other hand, the New Zealand economic calendar won’t have any relevant news to offer for the rest of the week.
Reacting to the uncertainty regarding the latest US debt-ceiling bill passing, the US bond yields are edging lower, signaling a higher demand for American bonds. The 10-year bond yield is trading at 3.66%, down by 1.33% on the day. The 2-year yield stands at 4.38% with 2.12 % losses; and the 5-year yield is at 3.77% with 1.33% losses. However, the Greenback as measured by the US Dollar index (DXY) is holding its ground at the 104.35 level, trading with 0.30% gains on the day.
Furthermore, the JOLTS Job Openings report for April from the US, released on Wednesday, exceeded expectations at 10.10 million compared to the anticipated 9.37 million.On the other hand, the Beige Book, published by the Federal Reserve, which provides a varied assessment of the current state of the US economy showed a mixed outlook. According to the report, there was minimal overall change in economic activity during April and early May. However, it highlighted that consumer spending maintained a consistent upward trend, while the service sector experienced a moderate decline in the most recent reporting period.
Automatic Data Processing Inc. will disclose May’s employment change figures on Thursday. The US Bureau of Labor Statistics will release the Nonfarm Payrolls (NFP) report for the same month on Friday and these reports are expected to reflect ongoing challenges in the US labor market. They could influence the Federal Reserve’s decision and the dynamics of the US Dollar. The CME FedWatch tool shows a 32% odds of a rate hike at the next FOMC meeting.
The NZD/USD has a clear bearish outlook for the short term, as per the daily chart. The Relative Strength Index (RSI) and Moving Average Convergence Divergence (MACD) are both in negative territory, and the pair trades below its main moving averages indicating that the sellers are in control.
The daily low at 0.5985 level remains the key support level for USD/NZD. If broken, the 0.5980 zone and the 0.5960 level could come into play. Furthermore, a move above the 0.6000 zone would fuel bullish momentum for the Kiwi, with next resistances at the psychological mark at 0.6050 and the 0.6100 level.
Technical Levels: Supports and Resistances
NZDUSD currently trading at 0.6011 at the time of writing. Pair opened at 0.6044 and is trading with a change of -0.55 % .
| Overview | Overview.1 | |
|---|---|---|
| 0 | Today last price | 0.6011 |
| 1 | Today Daily Change | -0.0033 |
| 2 | Today Daily Change % | -0.5500 |
| 3 | Today daily open | 0.6044 |
The pair remains strongly bearish on the daily time frame. It trades below the 20 SMA @ 0.6213, 50 SMA 0.6214, 100 SMA @ 0.626 and 200 SMA @ 0.6152.
| Trends | Trends.1 | |
|---|---|---|
| 0 | Daily SMA20 | 0.6213 |
| 1 | Daily SMA50 | 0.6214 |
| 2 | Daily SMA100 | 0.6260 |
| 3 | Daily SMA200 | 0.6152 |
The previous day high was 0.6067 while the previous day low was 0.6025. The daily 38.2% Fib levels comes at 0.6041, expected to provide resistance. Similarly, the daily 61.8% fib level is at 0.6051, expected to provide resistance.
Note the levels of interest below:
- Pivot support is noted at 0.6024, 0.6003, 0.5982
- Pivot resistance is noted at 0.6066, 0.6087, 0.6108
| Levels | Levels.1 |
|---|---|
| Previous Daily High | 0.6067 |
| Previous Daily Low | 0.6025 |
| Previous Weekly High | 0.6303 |
| Previous Weekly Low | 0.6032 |
| Previous Monthly High | 0.6389 |
| Previous Monthly Low | 0.6111 |
| Daily Fibonacci 38.2% | 0.6041 |
| Daily Fibonacci 61.8% | 0.6051 |
| Daily Pivot Point S1 | 0.6024 |
| Daily Pivot Point S2 | 0.6003 |
| Daily Pivot Point S3 | 0.5982 |
| Daily Pivot Point R1 | 0.6066 |
| Daily Pivot Point R2 | 0.6087 |
| Daily Pivot Point R3 | 0.6108 |
[/s2If]
Nehcap Expert Advisor
The NEHCAP MT4 EA is high quality professional trading system geared to generate returns without using GRID or martingales. Each trade has strict risk per trade parameter. The pairs under management include EURUSD, GBPUSD, AUDCAD, AUDNZD,GBPAUD, EURAUD, EURCAD, CHFJPY and many more.
The system is trading live: LIVE ACCOUNT TRACKING
You can run it free. Apply for a free trial and track our account. Buy the system or use profit share mechanism to generate returns on your MT4.
Join Our Telegram Group
")


