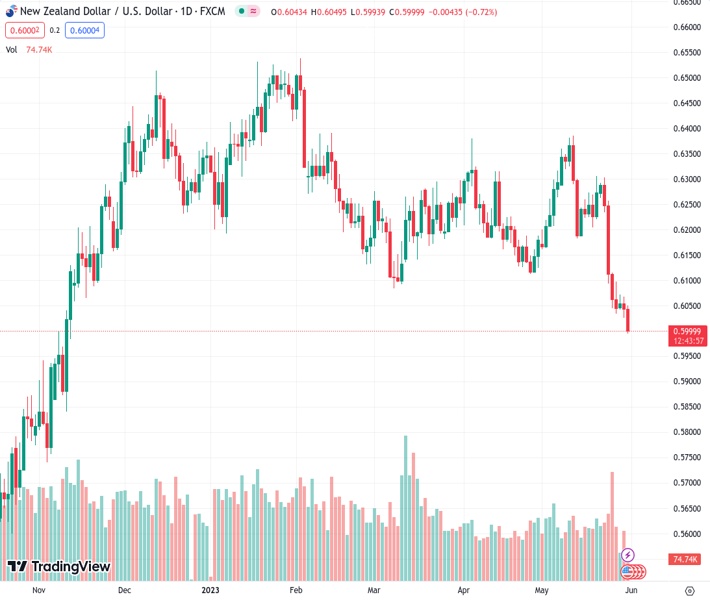
#NZDUSD @ 0.59989 dives to over a six-month low on Wednesday and seems vulnerable to sliding further. (Pivot Orderbook analysis)
…
This is a premium post.
[s2If !current_user_can(access_s2member_level4)]Please register for FREE REGISTER to read full post below containing analysis. In case of any error or you think you are not able to read the full post below, please email us at support#nehcap.com [lwa][/s2If] [s2If current_user_can(access_s2member_level1)]
- NZD/USD dives to over a six-month low on Wednesday and seems vulnerable to sliding further.
- A combination of factors lifts the USD closer to over a two-month high and weighs on the pair.
- A slightly oversold RSI might hold back traders from placing fresh bearish bets and limit losses.
The pair currently trades last at 0.59989.
The previous day high was 0.6067 while the previous day low was 0.6025. The daily 38.2% Fib levels comes at 0.6041, expected to provide resistance. Similarly, the daily 61.8% fib level is at 0.6051, expected to provide resistance.
The NZD/USD pair comes under intense selling pressure on Wednesday and maintains its heavily offered tone through the early part of the European session. The pair is currently placed just below the 0.6000 psychological mark – its lowest since November 10 – and seems vulnerable to prolonging its recent bearish trend witnessed over the past three weeks or so.
The New Zealand Dollar (NZD) continues to be undermined by the Reserve Bank of New Zealand’s (RBNZ) explicit signal last week that it was done with its most aggressive hiking cycle since 1999. The US Dollar (USD), on the other hand, climbs back closer to over a two-month high touched on Tuesday and turns out to be another factor exerting pressure on the NZD/USD pair for the second successive day.
Investors seem convinced that the US central bank will keep interest rates higher for longer and have been pricing in a greater chance of another 25 bps lift-off at the June FOMC meeting. The bets were lifted by the US PCE Price Index data on Friday, which showed that inflation remains sticky. Apart from this, a fresh wave of a global risk-aversion trade provides an additional boost to the safe-haven Greenback.
The market sentiment remains fragile amid worries about slowing global economic growth. The fears were further fueled by the disappointing Chinese macro data released this Wednesday. In fact, the National Bureau of Statistics (NBS) reported this Wednesday that China’s factory activity shrank faster than expected in May. Furthermore, business activity in China’s service expanded at the slowest pace in four months.
This, along with concerns about the worsening US-China ties overshadow the optimism over raising the US debt ceiling and temper investors’ appetite for riskier assets, which further contributes to driving flows away from the risk-sensitive Kiwi. Meanwhile, the ongoing slide in the US Treasury bonds yields – led by the global flight to safety – could act as a headwind for the USD. Apart from this, a slightly oversold Relative Strength Index (RSI) on the daily chart might hold back bears from placing fresh bets around the NZD/USD pair.
Technical Levels: Supports and Resistances
NZDUSD currently trading at 0.5995 at the time of writing. Pair opened at 0.6044 and is trading with a change of -0.81 % .
| Overview | Overview.1 | |
|---|---|---|
| 0 | Today last price | 0.5995 |
| 1 | Today Daily Change | -0.0049 |
| 2 | Today Daily Change % | -0.8100 |
| 3 | Today daily open | 0.6044 |
The pair remains strongly bearish on the daily time frame. It trades below the 20 SMA @ 0.6213, 50 SMA 0.6214, 100 SMA @ 0.626 and 200 SMA @ 0.6152.
| Trends | Trends.1 | |
|---|---|---|
| 0 | Daily SMA20 | 0.6213 |
| 1 | Daily SMA50 | 0.6214 |
| 2 | Daily SMA100 | 0.6260 |
| 3 | Daily SMA200 | 0.6152 |
The previous day high was 0.6067 while the previous day low was 0.6025. The daily 38.2% Fib levels comes at 0.6041, expected to provide resistance. Similarly, the daily 61.8% fib level is at 0.6051, expected to provide resistance.
Note the levels of interest below:
- Pivot support is noted at 0.6024, 0.6003, 0.5982
- Pivot resistance is noted at 0.6066, 0.6087, 0.6108
| Levels | Levels.1 |
|---|---|
| Previous Daily High | 0.6067 |
| Previous Daily Low | 0.6025 |
| Previous Weekly High | 0.6303 |
| Previous Weekly Low | 0.6032 |
| Previous Monthly High | 0.6389 |
| Previous Monthly Low | 0.6111 |
| Daily Fibonacci 38.2% | 0.6041 |
| Daily Fibonacci 61.8% | 0.6051 |
| Daily Pivot Point S1 | 0.6024 |
| Daily Pivot Point S2 | 0.6003 |
| Daily Pivot Point S3 | 0.5982 |
| Daily Pivot Point R1 | 0.6066 |
| Daily Pivot Point R2 | 0.6087 |
| Daily Pivot Point R3 | 0.6108 |
[/s2If]
Nehcap Expert Advisor
The NEHCAP MT4 EA is high quality professional trading system geared to generate returns without using GRID or martingales. Each trade has strict risk per trade parameter. The pairs under management include EURUSD, GBPUSD, AUDCAD, AUDNZD,GBPAUD, EURAUD, EURCAD, CHFJPY and many more.
The system is trading live: LIVE ACCOUNT TRACKING
You can run it free. Apply for a free trial and track our account. Buy the system or use profit share mechanism to generate returns on your MT4.
Join Our Telegram Group
")


