#GBPJPY @ 173.199 remains unchanged mainly but sustains its bullish bias, ending Wednesday’s session at 173.30 after a dip to 172.51. (Pivot Orderbook analysis)
…
This is a premium post.
[s2If !current_user_can(access_s2member_level4)]Please register for FREE REGISTER to read full post below containing analysis. In case of any error or you think you are not able to read the full post below, please email us at support#nehcap.com [lwa][/s2If] [s2If current_user_can(access_s2member_level1)]
- GBP/JPY remains unchanged mainly but sustains its bullish bias, ending Wednesday’s session at 173.30 after a dip to 172.51.
- Candlestick patterns hint at a potential decline, pending confirmation with a close below the Tenkan-line.
- The RSI and 3-day RoC suggest a sustained upward trend, highlighting critical levels for price shifts.
The pair currently trades last at 173.199.
The previous day high was 174.28 while the previous day low was 172.99. The daily 38.2% Fib levels comes at 173.79, expected to provide resistance. Similarly, the daily 61.8% fib level is at 173.48, expected to provide resistance.
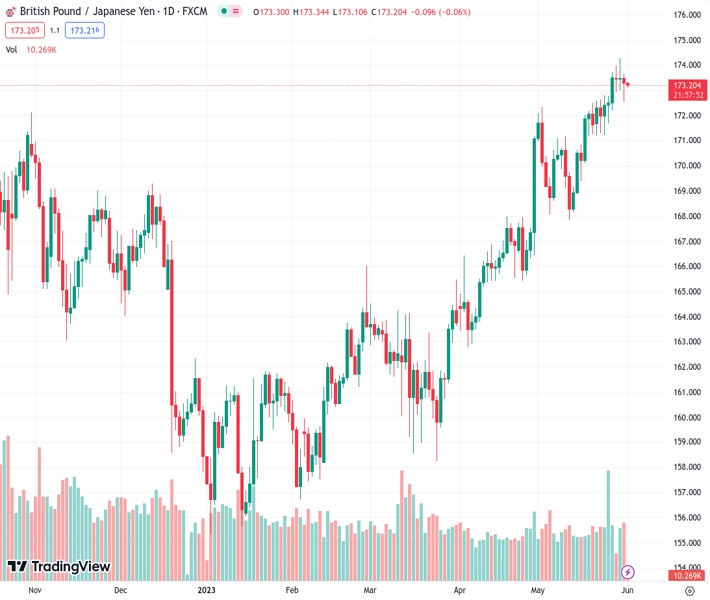
GBP/JPY ended Wednesday’s session almost flat after traveling from its daily low/high of 172.51-173.64. However, as the Asian session begins, the GBP/JPY floats around 173.24, unchanged but maintaining its bullish bias.
The GBP/JPY remains upward biased, per the daily chart, but it could have dipped lower. Thankfully, the Tenkan-Sen level at 172.73, which briefly pierced, opened the door for a GBP/JPY dip toward a new weekly low of 172.51 but acted as support as the GBP/JPY bounced off that price level, closing Wednesday’s session at 173.30.
During the last three days, the GBP/JPY candlestick chart portrays two dojis, followed by one hanging-man, suggesting further downside is expected. But, the GBP/JPY must achieve a daily close below the Tenkan-line. A breach of the latter will expose the May 2 daily high shifted support at 172.33 before reaching the Chikou-Span peak of March 27 at 171.69. Once cleared, the GBP/JPY can fall toward the Kijun-Sen at 170.29.
Conversely, for a GBP/JPY bullish continuation, the cross needs to conquer the 174.00 mark. Clearance of that level could pave the way to test the YTD high of 174.24 before opening the door to the 2016 high of 177.37.
Oscillators like the Relative Strength Index (RSI) indicator and the 3-day Rate of Change (RoC) warrant further upside expected. Therefore, the trend I set to continue upward.
Technical Levels: Supports and Resistances
GBPJPY currently trading at 173.23 at the time of writing. Pair opened at 173.54 and is trading with a change of -0.18 % .
| Overview | Overview.1 | |
|---|---|---|
| 0 | Today last price | 173.23 |
| 1 | Today Daily Change | -0.31 |
| 2 | Today Daily Change % | -0.18 |
| 3 | Today daily open | 173.54 |
The pair remains strongly bullish on the daily timeframe. It trades above its 20 SMA @ 171.15, 50 SMA 167.72, 100 SMA @ 164.32 and 200 SMA @ 164.3.
| Trends | Trends.1 | |
|---|---|---|
| 0 | Daily SMA20 | 171.15 |
| 1 | Daily SMA50 | 167.72 |
| 2 | Daily SMA100 | 164.32 |
| 3 | Daily SMA200 | 164.30 |
The previous day high was 174.28 while the previous day low was 172.99. The daily 38.2% Fib levels comes at 173.79, expected to provide resistance. Similarly, the daily 61.8% fib level is at 173.48, expected to provide resistance.
Note the levels of interest below:
- Pivot support is noted at 172.93, 172.32, 171.64
- Pivot resistance is noted at 174.22, 174.89, 175.5
| Levels | Levels.1 |
|---|---|
| Previous Daily High | 174.28 |
| Previous Daily Low | 172.99 |
| Previous Weekly High | 173.74 |
| Previous Weekly Low | 171.20 |
| Previous Monthly High | 171.18 |
| Previous Monthly Low | 162.78 |
| Daily Fibonacci 38.2% | 173.79 |
| Daily Fibonacci 61.8% | 173.48 |
| Daily Pivot Point S1 | 172.93 |
| Daily Pivot Point S2 | 172.32 |
| Daily Pivot Point S3 | 171.64 |
| Daily Pivot Point R1 | 174.22 |
| Daily Pivot Point R2 | 174.89 |
| Daily Pivot Point R3 | 175.50 |
[/s2If]
Nehcap Expert Advisor
The NEHCAP MT4 EA is high quality professional trading system geared to generate returns without using GRID or martingales. Each trade has strict risk per trade parameter. The pairs under management include EURUSD, GBPUSD, AUDCAD, AUDNZD,GBPAUD, EURAUD, EURCAD, CHFJPY and many more.
The system is trading live: LIVE ACCOUNT TRACKING
You can run it free. Apply for a free trial and track our account. Buy the system or use profit share mechanism to generate returns on your MT4.
Join Our Telegram Group
")


