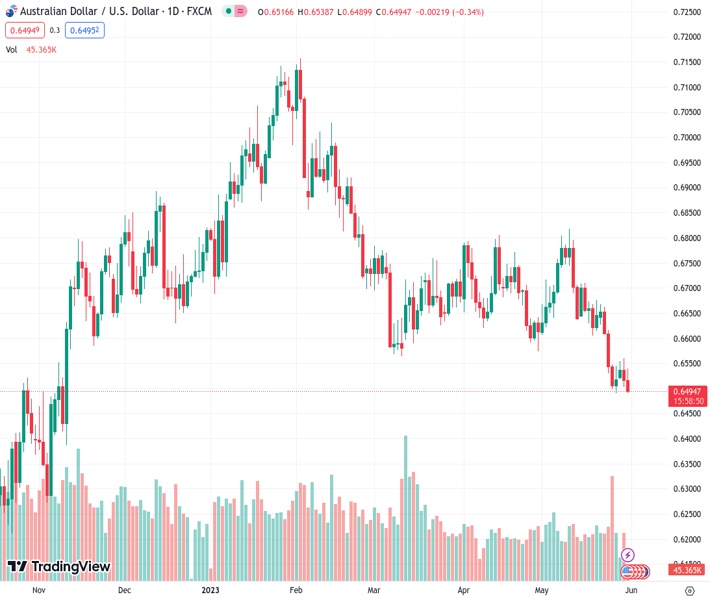
#AUDUSD @ 0.64981 is hovering below 0.6500 amid sheer strength in the USD Index. (Pivot Orderbook analysis)
…
This is a premium post.
[s2If !current_user_can(access_s2member_level4)]Please register for FREE REGISTER to read full post below containing analysis. In case of any error or you think you are not able to read the full post below, please email us at support#nehcap.com [lwa][/s2If] [s2If current_user_can(access_s2member_level1)]
- AUD/USD is hovering below 0.6500 amid sheer strength in the USD Index.
- The Australian Dollar has witnessed selling pressure despite the higher-than-expected Australian CPI release.
- AUD/USD has been strongly dumped after testing the breakout region of the consolidation around 0.6560.
The pair currently trades last at 0.64981.
The previous day high was 0.6559 while the previous day low was 0.6503. The daily 38.2% Fib levels comes at 0.6524, expected to provide resistance. Similarly, the daily 61.8% fib level is at 0.6538, expected to provide resistance.
The AUD/USD pair has shifted its auction below the round-level support of 0.6500 in the Asian session. The Aussie asset has faced immense selling interest despite higher-than-anticipated monthly Australian inflation data.
Monthly Australian Consumer Price Index (CPI) (April) soared to 6.8% vs. the estimates of 6.4% and the former release of 6.3%. This could force the Reserve Bank of Australia (RBA) to continue hiking interest rates as the battle against stubborn inflation is getting more complicated.
The US Dollar Index (DXY) is struggling in extending its rally above 104.35, however, the upside seems favored as chances of one more interest rate hike by the Federal Reserve (Fed) are soaring. Meanwhile, Cleveland Federal Reserve Bank President, Loretta Mester, in an interview with Financial Times, cited “I don’t really see a compelling reason to pause — meaning wait until you get more evidence to decide what to do.”
AUD/USD has been strongly dumped by the market participants after testing the breakout region of the prolonged consolidation around 0.6560 on a daily scale. The consolidation formed in a wide range of 0.6562-0.6810 in which inventory adjustment took place.
Downward-sloping 10-period Exponential Moving Average (EMA) at 0.6558 indicates that the short-term bearish bias is extremely solid.
The Relative Strength Index (RSI) (14) is oscillating in the bearish range of 20.00-40.00, showing no signs of divergence and any evidence of an oversold situation, which advocates more weakness ahead.
Should the asset slips confidently below 0.6490, US Dollar bulls would drag the Aussie asset to 01 November 2022 high around 0.6464 followed by the round-level support at 0.6400.
In an alternate scenario, a recovery move above April 28 low at 0.6574 will drive the asset toward April 10 low at 0.6620 and May 19 high at 0.6675.
Technical Levels: Supports and Resistances
AUDUSD currently trading at 0.6493 at the time of writing. Pair opened at 0.6517 and is trading with a change of -0.37 % .
| Overview | Overview.1 | |
|---|---|---|
| 0 | Today last price | 0.6493 |
| 1 | Today Daily Change | -0.0024 |
| 2 | Today Daily Change % | -0.3700 |
| 3 | Today daily open | 0.6517 |
The pair remains strongly bearish on the daily time frame. It trades below the 20 SMA @ 0.6648, 50 SMA 0.667, 100 SMA @ 0.6766 and 200 SMA @ 0.67.
| Trends | Trends.1 | |
|---|---|---|
| 0 | Daily SMA20 | 0.6648 |
| 1 | Daily SMA50 | 0.6670 |
| 2 | Daily SMA100 | 0.6766 |
| 3 | Daily SMA200 | 0.6700 |
The previous day high was 0.6559 while the previous day low was 0.6503. The daily 38.2% Fib levels comes at 0.6524, expected to provide resistance. Similarly, the daily 61.8% fib level is at 0.6538, expected to provide resistance.
Note the levels of interest below:
- Pivot support is noted at 0.6494, 0.647, 0.6437
- Pivot resistance is noted at 0.655, 0.6583, 0.6607
| Levels | Levels.1 |
|---|---|
| Previous Daily High | 0.6559 |
| Previous Daily Low | 0.6503 |
| Previous Weekly High | 0.6668 |
| Previous Weekly Low | 0.6490 |
| Previous Monthly High | 0.6806 |
| Previous Monthly Low | 0.6574 |
| Daily Fibonacci 38.2% | 0.6524 |
| Daily Fibonacci 61.8% | 0.6538 |
| Daily Pivot Point S1 | 0.6494 |
| Daily Pivot Point S2 | 0.6470 |
| Daily Pivot Point S3 | 0.6437 |
| Daily Pivot Point R1 | 0.6550 |
| Daily Pivot Point R2 | 0.6583 |
| Daily Pivot Point R3 | 0.6607 |
[/s2If]
Nehcap Expert Advisor
The NEHCAP MT4 EA is high quality professional trading system geared to generate returns without using GRID or martingales. Each trade has strict risk per trade parameter. The pairs under management include EURUSD, GBPUSD, AUDCAD, AUDNZD,GBPAUD, EURAUD, EURCAD, CHFJPY and many more.
The system is trading live: LIVE ACCOUNT TRACKING
You can run it free. Apply for a free trial and track our account. Buy the system or use profit share mechanism to generate returns on your MT4.
Join Our Telegram Group
")


