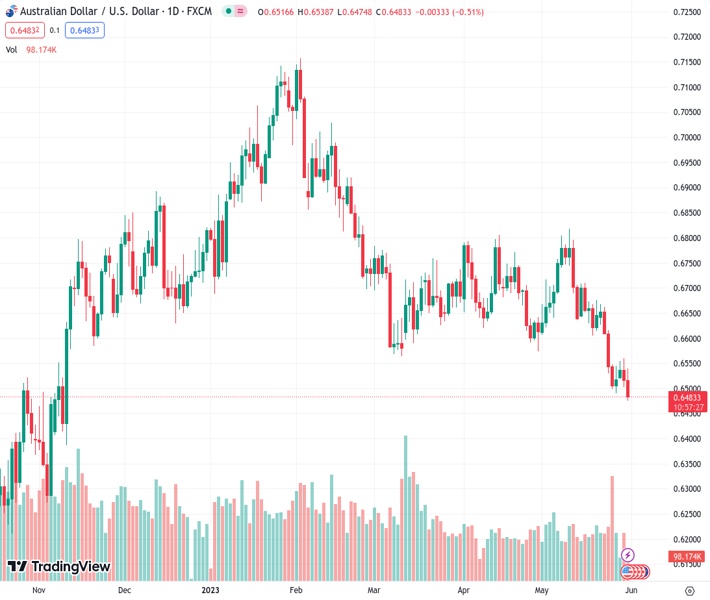
#AUDUSD @ 0.64835 comes under intense selling pressure and dives to its lowest level since November. (Pivot Orderbook analysis)
…
This is a premium post.
[s2If !current_user_can(access_s2member_level4)]Please register for FREE REGISTER to read full post below containing analysis. In case of any error or you think you are not able to read the full post below, please email us at support#nehcap.com [lwa][/s2If] [s2If current_user_can(access_s2member_level1)]
- AUD/USD comes under intense selling pressure and dives to its lowest level since November.
- Disappointing Chinese PMI prints overshadow stronger Australian consumer inflation figures.
- A combination of factors lifts the USD to over a two-month high and exerts pressure on the pair.
The pair currently trades last at 0.64835.
The previous day high was 0.6559 while the previous day low was 0.6503. The daily 38.2% Fib levels comes at 0.6524, expected to provide resistance. Similarly, the daily 61.8% fib level is at 0.6538, expected to provide resistance.
The AUD/USD pair attracts fresh sellers following an early uptick to the 0.6535-0.6540 region on Wednesday and continues to lose ground through the first half of the European session. This marks the second successive day of downfall and drags spot prices to the lowest level since November 10, around the 0.6475 area in the last hour.
The Australian Dollar (AUD) did get a minor lift following the release of stronger domestic consumer inflation figures, which could force the Reserve Bank of Australia (RBA) to tighten its monetary policy further. In fact, RBA Governor Philip Lowe had warned earlier today that sticky prices could invite more rate hikes by the central bank. The AUD/USD pair, however, struggles to capitalize on the intraday uptick after the disappointing Chinese macro data sparked fears about a global economic slowdown.
The National Bureau of Statistics (NBS) reported this Wednesday that China’s factory activity shrank faster than expected in May. Furthermore, business activity in China’s service expanded at the slowest pace in four months. Apart from this, concerns about the worsening US-China ties overshadow the optimism over raising the US debt ceiling. This, in turn, tempers investors’ appetite for perceived riskier assets, which, along with resurgent US Dollar (USD) demand, weigh on the risk-sensitive Aussie.
In fact, the USD Index (DXY), which tracks the Greenback against a basket of currencies, jumps to a fresh high since mid-March and remains well supported by expectations that the Federal Reserve (Fed) will keep interest rates higher for longer. In fact, the current market pricing indicates a greater chance of another 25 bps lift-off at the next FOMC policy meeting in June and the bets were reaffirmed by the stronger US Core PCE Price Index released on Friday, which showed that inflation remains sticky.
Apart from this, the risk-off impulse lends additional support to the safe-haven Greenback. Meanwhile, the global flight to safety leads to a further decline in the US Treasury bond yields, which might hold back the USD bulls from placing aggressive bets and help limit losses for the AUD/USD pair, at least for now. Nevertheless, the aforementioned fundamental backdrop suggests that the path of least resistance for spot prices is to the downside and any attempted recovery is likely to get sold into.
Moreover, sustained break and acceptance below the 0.6500 psychological mark validate the negative outlook. Market participants now look to the US economic docket, featuring the release of the Chicago PMI and JOLTS Job Openings data later during the early North American session. Traders will also take cues from speeches by influential FOMC members. This, along with the US bond yields and the broader risk sentiment, will drive the USD and provide some impetus to the AUD/USD pair.
Technical Levels: Supports and Resistances
AUDUSD currently trading at 0.6481 at the time of writing. Pair opened at 0.6517 and is trading with a change of -0.55 % .
| Overview | Overview.1 | |
|---|---|---|
| 0 | Today last price | 0.6481 |
| 1 | Today Daily Change | -0.0036 |
| 2 | Today Daily Change % | -0.5500 |
| 3 | Today daily open | 0.6517 |
The pair remains strongly bearish on the daily time frame. It trades below the 20 SMA @ 0.6648, 50 SMA 0.667, 100 SMA @ 0.6766 and 200 SMA @ 0.67.
| Trends | Trends.1 | |
|---|---|---|
| 0 | Daily SMA20 | 0.6648 |
| 1 | Daily SMA50 | 0.6670 |
| 2 | Daily SMA100 | 0.6766 |
| 3 | Daily SMA200 | 0.6700 |
The previous day high was 0.6559 while the previous day low was 0.6503. The daily 38.2% Fib levels comes at 0.6524, expected to provide resistance. Similarly, the daily 61.8% fib level is at 0.6538, expected to provide resistance.
Note the levels of interest below:
- Pivot support is noted at 0.6494, 0.647, 0.6437
- Pivot resistance is noted at 0.655, 0.6583, 0.6607
| Levels | Levels.1 |
|---|---|
| Previous Daily High | 0.6559 |
| Previous Daily Low | 0.6503 |
| Previous Weekly High | 0.6668 |
| Previous Weekly Low | 0.6490 |
| Previous Monthly High | 0.6806 |
| Previous Monthly Low | 0.6574 |
| Daily Fibonacci 38.2% | 0.6524 |
| Daily Fibonacci 61.8% | 0.6538 |
| Daily Pivot Point S1 | 0.6494 |
| Daily Pivot Point S2 | 0.6470 |
| Daily Pivot Point S3 | 0.6437 |
| Daily Pivot Point R1 | 0.6550 |
| Daily Pivot Point R2 | 0.6583 |
| Daily Pivot Point R3 | 0.6607 |
[/s2If]
Nehcap Expert Advisor
The NEHCAP MT4 EA is high quality professional trading system geared to generate returns without using GRID or martingales. Each trade has strict risk per trade parameter. The pairs under management include EURUSD, GBPUSD, AUDCAD, AUDNZD,GBPAUD, EURAUD, EURCAD, CHFJPY and many more.
The system is trading live: LIVE ACCOUNT TRACKING
You can run it free. Apply for a free trial and track our account. Buy the system or use profit share mechanism to generate returns on your MT4.
Join Our Telegram Group
")


