Asian stocks are facing the heat of weak China’s factory activity. (Pivot Orderbook analysis)
…
This is a premium post.
[s2If !current_user_can(access_s2member_level4)]Please register for FREE REGISTER to read full post below containing analysis. In case of any error or you think you are not able to read the full post below, please email us at support#nehcap.com [lwa][/s2If] [s2If current_user_can(access_s2member_level1)]
- Asian stocks are facing the heat of weak China’s factory activity.
- Global market mood has turned cautious ahead of US Employment data.
- OPEC members are expected to discuss production cuts to support energy prices.
The pair currently trades last at 31126.7.
The previous day high was 31432.35 while the previous day low was 31050.05. The daily 38.2% Fib levels comes at 31196.09, expected to provide resistance. Similarly, the daily 61.8% fib level is at 31286.31, expected to provide resistance.
Markets in the Asian session have nosedived as investors underpinned the risk-aversion theme after disappointing China’s official Manufacturing PMI data. China’s official PMI data released in Asia remained mixed as manufacturing activities remained downbeat while non-manufacturing PMI outperformed estimates.
Global market mood has turned cautious as investors are awaiting the release of the United States Employment data, which will provide a base to Federal Reserve (Fed) policymakers for building a further roadmap of bringing down stubborn inflation. The rationale is rerating the US Dollar Index (DXY), which has jumped strongly to near 104.40.
At the press time, Japan’s Nikkei225 plunged 1.63%, ChinaA50 dived 1.66%, Hang Seng nosedived 2.56%, and Nifty50 dropped 0.50%.
Chinese equities faced selling pressure after domestic factory activity contracted despite swift reopening measures by the administration after remaining in lockdown curbs for three years. China’s National Bureau of Statistics (NBS) reported Manufacturing PMI at 48.8, lower than the estimates of 49.4 and the former release of 49.2. While Non-Manufacturing PMI jumped to 54.5 from the consensus of 50.7 but remained lower than the former figure of 56.4.
Japanese stocks remained under pressure after downbeat Retail Trade data. Annual Retail Trade data accelerated by 5.0% at a slower pace than expected at 7.0% and the former release of 7.2%. This could have some pressure on the Bank of Japan (BoJ) as weak retail demand could ease inflationary pressures. In early Asia, BoJ Ueda cited that the increase in inflationary pressures has been caused by supply factors such as a rapid rise in commodity prices, labor shortages, and disruptions to supply chains, which is not constructive for the economy.
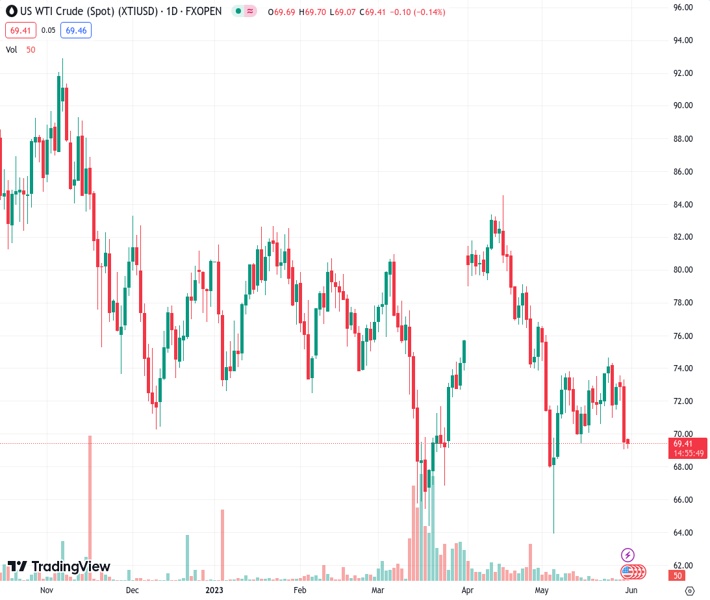
On the oil front, oil prices are consistently oscillating below the crucial resistance of $70.00. Investors are awaiting the outcome of OPEC’s meeting that will deliver guidance for further action. OPEC members are expected to discuss production cuts to support energy prices. Tensions with Russia are escalating as it is pumping cheap oil into the global economy, disregarding the pledge.
Technical Levels: Supports and Resistances
XTIUSD currently trading at 31126.7 at the time of writing. Pair opened at 31126.7 and is trading with a change of 0.0 % .
| Overview | Overview.1 | |
|---|---|---|
| 0 | Today last price | 31126.7 |
| 1 | Today Daily Change | 0.0 |
| 2 | Today Daily Change % | 0.0 |
| 3 | Today daily open | 31126.7 |
The pair remains strongly bullish on the daily timeframe. It trades above its 20 SMA @ 30082.74, 50 SMA 28951.25, 100 SMA @ 28155.06 and 200 SMA @ 27749.45.
| Trends | Trends.1 | |
|---|---|---|
| 0 | Daily SMA20 | 30082.74 |
| 1 | Daily SMA50 | 28951.25 |
| 2 | Daily SMA100 | 28155.06 |
| 3 | Daily SMA200 | 27749.45 |
The previous day high was 31432.35 while the previous day low was 31050.05. The daily 38.2% Fib levels comes at 31196.09, expected to provide resistance. Similarly, the daily 61.8% fib level is at 31286.31, expected to provide resistance.
Note the levels of interest below:
- Pivot support is noted at 30973.72, 30820.73, 30591.42
- Pivot resistance is noted at 31356.02, 31585.33, 31738.32
| Levels | Levels.1 |
|---|---|
| Previous Daily High | 31432.35 |
| Previous Daily Low | 31050.05 |
| Previous Weekly High | 31540.10 |
| Previous Weekly Low | 30389.99 |
| Previous Monthly High | 29058.52 |
| Previous Monthly Low | 27562.51 |
| Daily Fibonacci 38.2% | 31196.09 |
| Daily Fibonacci 61.8% | 31286.31 |
| Daily Pivot Point S1 | 30973.72 |
| Daily Pivot Point S2 | 30820.73 |
| Daily Pivot Point S3 | 30591.42 |
| Daily Pivot Point R1 | 31356.02 |
| Daily Pivot Point R2 | 31585.33 |
| Daily Pivot Point R3 | 31738.32 |
[/s2If]
Nehcap Expert Advisor
The NEHCAP MT4 EA is high quality professional trading system geared to generate returns without using GRID or martingales. Each trade has strict risk per trade parameter. The pairs under management include EURUSD, GBPUSD, AUDCAD, AUDNZD,GBPAUD, EURAUD, EURCAD, CHFJPY and many more.
The system is trading live: LIVE ACCOUNT TRACKING
You can run it free. Apply for a free trial and track our account. Buy the system or use profit share mechanism to generate returns on your MT4.
Join Our Telegram Group
")


