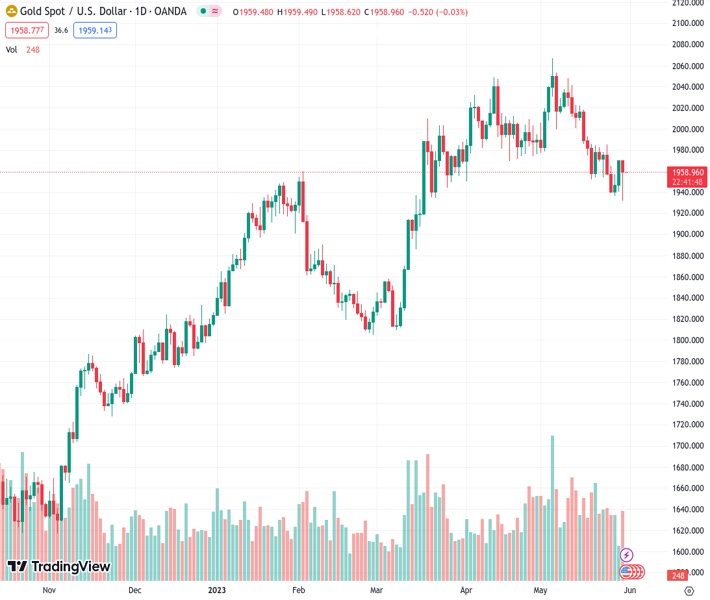
#XAUUSD @ 1,959.16 Gold price is consolidating around $1,960.00 after a vertical rally ahead of US Employment. (Pivot Orderbook analysis)
…
This is a premium post.
[s2If !current_user_can(access_s2member_level4)]Please register for FREE REGISTER to read full post below containing analysis. In case of any error or you think you are not able to read the full post below, please email us at support#nehcap.com [lwa][/s2If] [s2If current_user_can(access_s2member_level1)]
- Gold price is consolidating around $1,960.00 after a vertical rally ahead of US Employment.
- The USD Index witnessed intense selling pressure after printing a fresh 10-week high at 104.50.
- Gold price is gathering strength for a breakout above the trendline plotted from $1,952.00.
The pair currently trades last at 1959.16.
The previous day high was 1949.82 while the previous day low was 1940.36. The daily 38.2% Fib levels comes at 1943.97, expected to provide support. Similarly, the daily 61.8% fib level is at 1946.21, expected to provide support.
Gold price (XAU/USD) has turned sideways around $1,960.00 after failing to extend a rally above $1,963.70 in the early Asian session. A quick rally in the Gold price came after a vertical sell-off in the US Dollar Index (DXY). The USD Index witnessed intense selling pressure after printing a fresh 10-week high at 104.50.
S&P500 ended flat on Tuesday despite after an extended weekend, portraying a cautious market mood. Sheer volatility in the US equities cannot be ruled out ahead of the United States Employment data, which will build a base for June‘s monetary policy meeting by the Federal Reserve (Fed).
Despite a sell-off in the USD Index, investors are confident that the asset could be rerated ahead as one more interest rate hike by the Fed is yet to be discounted. Consumer spending has rebounded dramatically in April and now decent caliber in labor market conditions could force Fed chair Jerome Powell to look for raising interest rates further without any doubt.
On Thursday, US Automatic Data Processing (ADP) Employment data will be keenly watched. As per the consensus, the US economy added 170K jobs in May, lower than the prior addition of 296K. Later on Friday, US Nonfarm Payrolls (NFP) will release, which will provide comprehensive information about the US labor market.
Gold price showed a V-shape recovery after dropping to near $1,932.12 on an hourly scale. The asset is gathering strength for a breakout above the trendline plotted from May 18 low around $1,952.00, which acted as a resistance for the Gold price earlier. Meanwhile, the horizontal resistance is plotted from May 19 high at $1,984.25.
Upward sloping 20-period Exponential Moving Average (EMA) at $1,954.50 indicates that the short-term trend has turned positive.
The Relative Strength Index (RSI) (14) has shifted into the bullish range of 60.00-80.00, which indicates that the upside momentum is active.
Technical Levels: Supports and Resistances
XAUUSD currently trading at 1959.28 at the time of writing. Pair opened at 1943.8 and is trading with a change of 0.8 % .
| Overview | Overview.1 | |
|---|---|---|
| 0 | Today last price | 1959.28 |
| 1 | Today Daily Change | 15.48 |
| 2 | Today Daily Change % | 0.80 |
| 3 | Today daily open | 1943.80 |
The pair is trading below its 20 Daily moving average @ 1994.66, below its 50 Daily moving average @ 1992.1 , above its 100 Daily moving average @ 1935.86 and above its 200 Daily moving average @ 1831.41
| Trends | Trends.1 | |
|---|---|---|
| 0 | Daily SMA20 | 1994.66 |
| 1 | Daily SMA50 | 1992.10 |
| 2 | Daily SMA100 | 1935.86 |
| 3 | Daily SMA200 | 1831.41 |
The previous day high was 1949.82 while the previous day low was 1940.36. The daily 38.2% Fib levels comes at 1943.97, expected to provide support. Similarly, the daily 61.8% fib level is at 1946.21, expected to provide support.
Note the levels of interest below:
- Pivot support is noted at 1939.5, 1935.2, 1930.04
- Pivot resistance is noted at 1948.96, 1954.12, 1958.42
| Levels | Levels.1 |
|---|---|
| Previous Daily High | 1949.82 |
| Previous Daily Low | 1940.36 |
| Previous Weekly High | 1985.30 |
| Previous Weekly Low | 1936.77 |
| Previous Monthly High | 2048.75 |
| Previous Monthly Low | 1949.83 |
| Daily Fibonacci 38.2% | 1943.97 |
| Daily Fibonacci 61.8% | 1946.21 |
| Daily Pivot Point S1 | 1939.50 |
| Daily Pivot Point S2 | 1935.20 |
| Daily Pivot Point S3 | 1930.04 |
| Daily Pivot Point R1 | 1948.96 |
| Daily Pivot Point R2 | 1954.12 |
| Daily Pivot Point R3 | 1958.42 |
[/s2If]
Nehcap Expert Advisor
The NEHCAP MT4 EA is high quality professional trading system geared to generate returns without using GRID or martingales. Each trade has strict risk per trade parameter. The pairs under management include EURUSD, GBPUSD, AUDCAD, AUDNZD,GBPAUD, EURAUD, EURCAD, CHFJPY and many more.
The system is trading live: LIVE ACCOUNT TRACKING
You can run it free. Apply for a free trial and track our account. Buy the system or use profit share mechanism to generate returns on your MT4.
Join Our Telegram Group
")


