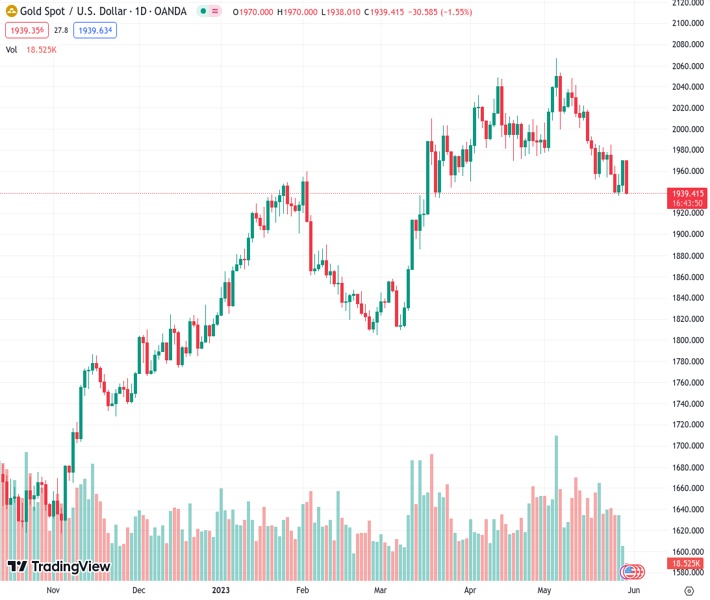
#XAUUSD @ 1939.35 Gold price has extended its downside to near $1,940.00 amid a solid recovery in the USD Index. (Pivot Orderbook analysis)
…
This is a premium post.
[s2If !current_user_can(access_s2member_level4)]Please register for FREE REGISTER to read full post below containing analysis. In case of any error or you think you are not able to read the full post below, please email us at support#nehcap.com [lwa][/s2If] [s2If current_user_can(access_s2member_level1)]
- Gold price has extended its downside to near $1,940.00 amid a solid recovery in the USD Index.
- The overall market mood has turned cautious as investors are anticipating one more interest rate hike from the Fed.
- Gold price has delivered a breakdown of the volatility contraction pattern and is anticipated to deliver a vertical fall
The pair currently trades last at 1939.35.
The previous day high was 1949.82 while the previous day low was 1940.36. The daily 38.2% Fib levels comes at 1943.97, expected to provide resistance. Similarly, the daily 61.8% fib level is at 1946.21, expected to provide resistance.
Gold price (XAU/USD) witnessed extreme selling pressure after a short-lived pullback move to near $1,946.70 in the Asian session. The precious metal has extended its downside journey to near $1,940.00 as the US Dollar Index (DXY) has recovered its entire losses and is aiming to print afresh day high above 104.34.
S&P500 futures are continuously easing gains generated on Monday as investors are worried that Tuesday’s trading session could be extremely volatile after an extended weekend. The overall market mood has turned cautious as investors are anticipating one more interest rate elevation from the Federal Reserve (Fed).
Earlier, Fed chair Jerome Powell cited that tight credit conditions by US regional banks are doing the job for the central bank as liquidity disbursement in the economy has dropped. Firms are facing barriers in augmenting working capital requirements and are satisfied with operating at less capacity.
However, fresh incoming data showed that consumer spending is sky-rocketing in the US economy, and labor market conditions have not eased as expected, which is forcing the Fed to continue its policy-tightening spell.
This week, the release of the US Employment data will provide more clarity about interest rate guidance. As per the consensus, Thursday’s Automatic Data Processing (ADP) Employment Change is expected to land at 170K lower than the former release of 296K.
Gold price has delivered a breakdown of the volatility contraction and is anticipated to deliver a vertical fall. Earlier, the precious metal displayed a downside move after a breakdown of the Symmetrical Triangle chart pattern on an hourly scale.
The 50-period Exponential Moving Average (EMA) at $1,948.00 has acted as a barricade for the Gold price.
Meanwhile, the Relative Strength Index (RSI) (14) has slipped below 40.00, which indicates that the downside momentum has been triggered.
Technical Levels: Supports and Resistances
XAUUSD currently trading at 1939.56 at the time of writing. Pair opened at 1943.8 and is trading with a change of -0.22 % .
| Overview | Overview.1 | |
|---|---|---|
| 0 | Today last price | 1939.56 |
| 1 | Today Daily Change | -4.24 |
| 2 | Today Daily Change % | -0.22 |
| 3 | Today daily open | 1943.80 |
The pair is trading below its 20 Daily moving average @ 1994.66, below its 50 Daily moving average @ 1992.1 , above its 100 Daily moving average @ 1935.86 and above its 200 Daily moving average @ 1831.41
| Trends | Trends.1 | |
|---|---|---|
| 0 | Daily SMA20 | 1994.66 |
| 1 | Daily SMA50 | 1992.10 |
| 2 | Daily SMA100 | 1935.86 |
| 3 | Daily SMA200 | 1831.41 |
The previous day high was 1949.82 while the previous day low was 1940.36. The daily 38.2% Fib levels comes at 1943.97, expected to provide resistance. Similarly, the daily 61.8% fib level is at 1946.21, expected to provide resistance.
Note the levels of interest below:
- Pivot support is noted at 1939.5, 1935.2, 1930.04
- Pivot resistance is noted at 1948.96, 1954.12, 1958.42
| Levels | Levels.1 |
|---|---|
| Previous Daily High | 1949.82 |
| Previous Daily Low | 1940.36 |
| Previous Weekly High | 1985.30 |
| Previous Weekly Low | 1936.77 |
| Previous Monthly High | 2048.75 |
| Previous Monthly Low | 1949.83 |
| Daily Fibonacci 38.2% | 1943.97 |
| Daily Fibonacci 61.8% | 1946.21 |
| Daily Pivot Point S1 | 1939.50 |
| Daily Pivot Point S2 | 1935.20 |
| Daily Pivot Point S3 | 1930.04 |
| Daily Pivot Point R1 | 1948.96 |
| Daily Pivot Point R2 | 1954.12 |
| Daily Pivot Point R3 | 1958.42 |
[/s2If]
Nehcap Expert Advisor
The NEHCAP MT4 EA is high quality professional trading system geared to generate returns without using GRID or martingales. Each trade has strict risk per trade parameter. The pairs under management include EURUSD, GBPUSD, AUDCAD, AUDNZD,GBPAUD, EURAUD, EURCAD, CHFJPY and many more.
The system is trading live: LIVE ACCOUNT TRACKING
You can run it free. Apply for a free trial and track our account. Buy the system or use profit share mechanism to generate returns on your MT4.
Join Our Telegram Group
")


