#USDMXN @ 17.6474 pair trades higher, fueled by risk-off sentiment and declining US bond yields. (Pivot Orderbook analysis)
…
This is a premium post.
[s2If !current_user_can(access_s2member_level4)]Please register for FREE REGISTER to read full post below containing analysis. In case of any error or you think you are not able to read the full post below, please email us at support#nehcap.com [lwa][/s2If] [s2If current_user_can(access_s2member_level1)]
- USD/MXN pair trades higher, fueled by risk-off sentiment and declining US bond yields.
- The Conference Board reports a decline in Consumer Confidence in May, reflecting a gloomy outlook among consumers, while housing prices rise above expectations.
- Richmond Fed President Barkin warns of stubborn inflation and mixed economic signals.
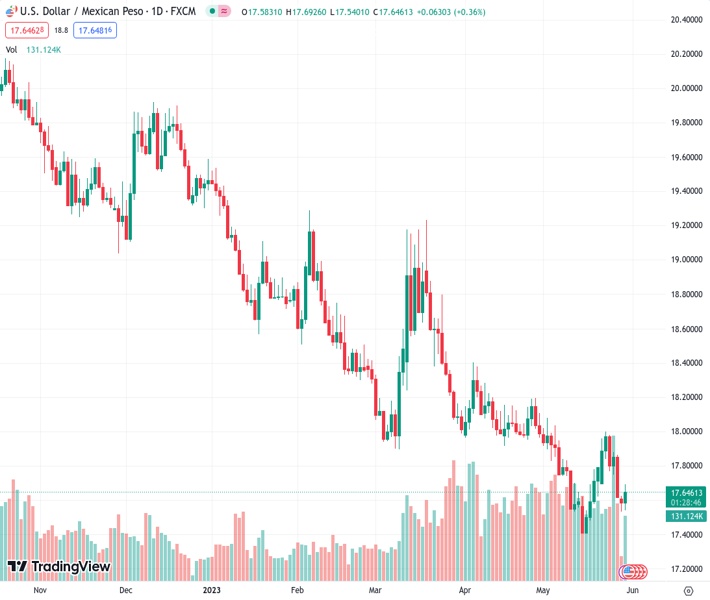
The pair currently trades last at 17.6474.
The previous day high was 17.639 while the previous day low was 17.5348. The daily 38.2% Fib levels comes at 17.5746, expected to provide support. Similarly, the daily 61.8% fib level is at 17.5992, expected to provide support.
USD/MXN climbs amidst a risk-off impulse as some Republicans said they would oppose a bipartisan agreement to lift the US debt ceiling, even though the US government could fail to pay its obligations. That shifted sentiment while US bond yields plunged. At the time of writing, the USD/MXN is trading at 17.6757, a gain of 0.52%.
US equities trade mixed; after a sudden shift in market sentiment, major indices pared their earlier gains. The US debt ceiling saga continues, with the GOP right-wing expected to oust Kevin McCarthy as House Speaker. On the data front, the US housing prices in March rose above estimates though they failed to trigger a reaction on the USD/MXN pair.
Later, the US Conference Board (CB) revealed that Consumer Confidence in May slowed to 102.3, above estimates but below April’s 103.7. “Consumer confidence declined in May as consumers’ view of current conditions became somewhat less upbeat while their expectations remained gloomy,” said Ataman Ozyildirim, Senior Director, Economics at The Conference Board. The report showed that Americans’ inflation expectations remain elevated but stable at a 6.1% average over the next 12 months.
The Dallas Fed Manufacturing Index for May plummeted by -29.1, below the previous month’s -23.4 contraction, signaling that business activity continued to deteriorate.
Aside from this, Richmond Fed President Thomas Barkin said that parts of the economy are giving mixed signals and that inflation is going to be more stubborn “than many people would think.”
The US Dollar Index (DXY), a gauge that measures the buck’s value against a basket of six currencies, is down 0.06%, at 104.116.
After two consecutive days of losses, the USD/MXN shifted upwards, though the rallies could be capped by solid resistance at the 20-day Exponential Moving Average (EMA) at 17.7600. Oscillators like the Relative Strength Index (RSI) indicator and the 3-day Rate of Change (RoC) are still in bearish territory, but the RSI is about to cross above the 50-midline.
For a bullish scenario, once USD/MXN buyers reclaim the 20-day EMA, that would open the door toward the confluence of a one-month-old falling resistance trendline and the 50-day EMA at 17.9593. Once cleared, the 18.00 figure is up for grabs. Conversely, the USD/MXN must reclaim the weekly low of 17.5341 before challenging the year-to-date (YTD) low of 17.4238.
Technical Levels: Supports and Resistances
USDMXN currently trading at 17.6728 at the time of writing. Pair opened at 17.5926 and is trading with a change of 0.46 % .
| Overview | Overview.1 | |
|---|---|---|
| 0 | Today last price | 17.6728 |
| 1 | Today Daily Change | 0.0802 |
| 2 | Today Daily Change % | 0.4600 |
| 3 | Today daily open | 17.5926 |
The pair remains strongly bearish on the daily time frame. It trades below the 20 SMA @ 17.7332, 50 SMA 17.9863, 100 SMA @ 18.3068 and 200 SMA @ 19.0323.
| Trends | Trends.1 | |
|---|---|---|
| 0 | Daily SMA20 | 17.7332 |
| 1 | Daily SMA50 | 17.9863 |
| 2 | Daily SMA100 | 18.3068 |
| 3 | Daily SMA200 | 19.0323 |
The previous day high was 17.639 while the previous day low was 17.5348. The daily 38.2% Fib levels comes at 17.5746, expected to provide support. Similarly, the daily 61.8% fib level is at 17.5992, expected to provide support.
Note the levels of interest below:
- Pivot support is noted at 17.5386, 17.4846, 17.4344
- Pivot resistance is noted at 17.6428, 17.693, 17.747
| Levels | Levels.1 |
|---|---|
| Previous Daily High | 17.6390 |
| Previous Daily Low | 17.5348 |
| Previous Weekly High | 17.9981 |
| Previous Weekly Low | 17.6165 |
| Previous Monthly High | 18.4018 |
| Previous Monthly Low | 17.9329 |
| Daily Fibonacci 38.2% | 17.5746 |
| Daily Fibonacci 61.8% | 17.5992 |
| Daily Pivot Point S1 | 17.5386 |
| Daily Pivot Point S2 | 17.4846 |
| Daily Pivot Point S3 | 17.4344 |
| Daily Pivot Point R1 | 17.6428 |
| Daily Pivot Point R2 | 17.6930 |
| Daily Pivot Point R3 | 17.7470 |
[/s2If]
Nehcap Expert Advisor
The NEHCAP MT4 EA is high quality professional trading system geared to generate returns without using GRID or martingales. Each trade has strict risk per trade parameter. The pairs under management include EURUSD, GBPUSD, AUDCAD, AUDNZD,GBPAUD, EURAUD, EURCAD, CHFJPY and many more.
The system is trading live: LIVE ACCOUNT TRACKING
You can run it free. Apply for a free trial and track our account. Buy the system or use profit share mechanism to generate returns on your MT4.
Join Our Telegram Group
")


