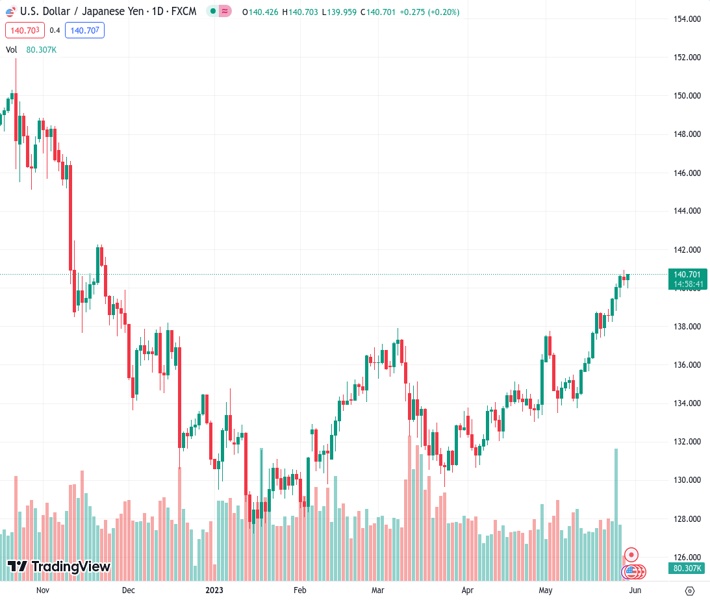
#USDJPY @ 140.674 recovers from intraday low within three-week-old bullish chart formation., @nehcap view: Further upside expected (Pivot Orderbook analysis)
…
This is a premium post.
[s2If !current_user_can(access_s2member_level4)]Please register for FREE REGISTER to read full post below containing analysis. In case of any error or you think you are not able to read the full post below, please email us at support#nehcap.com [lwa][/s2If] [s2If current_user_can(access_s2member_level1)]
- USD/JPY recovers from intraday low within three-week-old bullish chart formation.
- Monday’s bearish candlestick formation, overbought RSI (14) line lure bears.
- Clear downside break of 140.00 needed to lure the Yen buyers.
- Bulls need 141.00 breakout to aim for late November peak.
The pair currently trades last at 140.674.
The previous day high was 140.92 while the previous day low was 140.11. The daily 38.2% Fib levels comes at 140.42, expected to provide support. Similarly, the daily 61.8% fib level is at 140.61, expected to provide support.
USD/JPY makes rounds to 140.50 as bulls and bears jostle amid mixed technical signals heading into Tuesday’s European session.
That said, the Yen pair portrays a three-week-old bullish channel, currently between 140.20 and 141.85, to keep the buyers hopeful.
However, the oversold conditions of the RSI (14) line join Monday’s “Shooting Star” candlestick to suggest that the bulls are running out of steam.
As a result, the USD/JPY traders should remain cautious before taking any fresh positions, especially on the short side considering the US Dollar’s broad strength, unless the quote remains within the stated channel.
Even if the quote breaks the 140.20 support, the 140.00 psychological magnet will act as an extra filter toward the south before directing the bears toward the 200-SMA level of 137.25.
Following that, an upward-sloping support line from March 24, close to 135.80 at the latest, will be the key to defending the buyers.
On the flip side, the USD/JPY pair’s successful trading above the previous day’s peak of 140.92 defies the bearish candlestick. However, the buyers will need to cross the 141.00 round figure for conviction.
In that case, the late November 2022 peak of 142.25 may act as an intermediate halt ahead of directing the bulls to the stated channel’s top line of around 142.85.
Trend: Further upside expected
Technical Levels: Supports and Resistances
USDJPY currently trading at 140.48 at the time of writing. Pair opened at 140.46 and is trading with a change of 0.01% % .
| Overview | Overview.1 | |
|---|---|---|
| 0 | Today last price | 140.48 |
| 1 | Today Daily Change | 0.02 |
| 2 | Today Daily Change % | 0.01% |
| 3 | Today daily open | 140.46 |
The pair remains strongly bullish on the daily timeframe. It trades above its 20 SMA @ 136.99, 50 SMA 134.67, 100 SMA @ 133.6 and 200 SMA @ 137.24.
| Trends | Trends.1 | |
|---|---|---|
| 0 | Daily SMA20 | 136.99 |
| 1 | Daily SMA50 | 134.67 |
| 2 | Daily SMA100 | 133.60 |
| 3 | Daily SMA200 | 137.24 |
The previous day high was 140.92 while the previous day low was 140.11. The daily 38.2% Fib levels comes at 140.42, expected to provide support. Similarly, the daily 61.8% fib level is at 140.61, expected to provide support.
Note the levels of interest below:
- Pivot support is noted at 140.08, 139.69, 139.27
- Pivot resistance is noted at 140.88, 141.3, 141.69
| Levels | Levels.1 |
|---|---|
| Previous Daily High | 140.92 |
| Previous Daily Low | 140.11 |
| Previous Weekly High | 140.72 |
| Previous Weekly Low | 137.49 |
| Previous Monthly High | 136.56 |
| Previous Monthly Low | 130.63 |
| Daily Fibonacci 38.2% | 140.42 |
| Daily Fibonacci 61.8% | 140.61 |
| Daily Pivot Point S1 | 140.08 |
| Daily Pivot Point S2 | 139.69 |
| Daily Pivot Point S3 | 139.27 |
| Daily Pivot Point R1 | 140.88 |
| Daily Pivot Point R2 | 141.30 |
| Daily Pivot Point R3 | 141.69 |
[/s2If]
Nehcap Expert Advisor
The NEHCAP MT4 EA is high quality professional trading system geared to generate returns without using GRID or martingales. Each trade has strict risk per trade parameter. The pairs under management include EURUSD, GBPUSD, AUDCAD, AUDNZD,GBPAUD, EURAUD, EURCAD, CHFJPY and many more.
The system is trading live: LIVE ACCOUNT TRACKING
You can run it free. Apply for a free trial and track our account. Buy the system or use profit share mechanism to generate returns on your MT4.
Join Our Telegram Group
")


