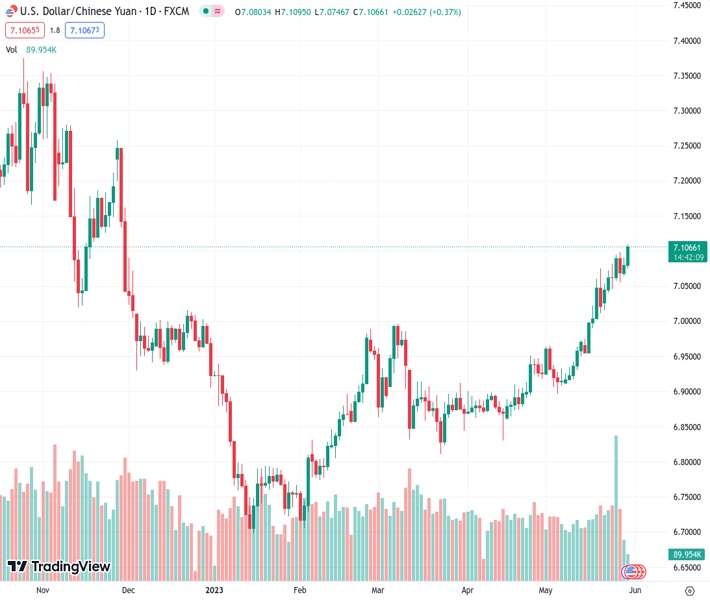
#USDCNH @ 7.10870 extends week-start gains to approach the highest levels since November 2022. (Pivot Orderbook analysis)
…
This is a premium post.
[s2If !current_user_can(access_s2member_level4)]Please register for FREE REGISTER to read full post below containing analysis. In case of any error or you think you are not able to read the full post below, please email us at support#nehcap.com [lwa][/s2If] [s2If current_user_can(access_s2member_level1)]
- USD/CNH extends week-start gains to approach the highest levels since November 2022.
- US Dollar regains upside momentum amid mixed concerns about US debt ceiling deal, hawkish Fed bets.
- US-China tension escalates as Beijing turns down Washington’s request for Defense Chief meeting.
- Risk catalysts, US CB Consumer Confidence eyed for clear directions.
The pair currently trades last at 7.10870.
The previous day high was 7.0912 while the previous day low was 7.0642. The daily 38.2% Fib levels comes at 7.0809, expected to provide support. Similarly, the daily 61.8% fib level is at 7.0746, expected to provide support.
USD/CNH bulls keep the reins for the second consecutive day as bulls prod the six-month high heading into Tuesday’s European session, up 0.30% intraday near 7.1050 by the press time.
In doing so, the offshore Chinese Yuan (CNH) pair takes clues from the broad US Dollar strength amid lackluster initial hours of a trading day when all the traders return to the table after a long weekend.
US Dollar Index (DXY) rises to a fresh high in 10 weeks as it prints the 104.50 mark at the latest.
With this, the greenback’s gauge versus six major currencies benefits from its safe-haven asset, as well as the recently hawkish Federal Reserve (Fed) bets.
Talking about the risks, the market’s mood remains unclear even as S&P500 Futures print mild gains and the yields retreat, which in turn pushes the traders towards the US Dollar, especially after the last week’s upbeat US data favoring the hawkish Fed concerns.
Among the key risk catalysts, the dissatisfaction of some of the US policymakers, mostly Republicans, are against the compromises made to their previous demands to reach the deal. The policymakers also show readiness to challenge the agreement in the House, as well as in the Senate, which in turn prods the market’s previous risk-on mood and keeps the US Dollar on the front foot. Additionally, the US-China woes also underpin the market’s rush toward the US Dollar and propel the USD/CNH price. Late on Monday, China turned down the US request for a meeting of the Defense Chiefs in Singapore, per the Wall Street Journal (WSJ).
On the other hand, the monetary policy divergence between the People’s Bank of China’s (PBOC) dovish outlook and the hawkish concerns about the Fed offer additional strength to the USD/CNH price.
Moving on, the US Conference Boards’ (CB) Consumer Confidence data for May will offer immediate directions to the USD/CNH pair traders ahead of Wednesday’s official PMIs from China and the US House voting on the debt-ceiling agreement. Following that, the US Senate’s approval of the US debt ceiling deal before June 05, as well as Friday’s US jobs report, become the key to watch for a clear guide.
USD/CNH picks up bids to refresh multi-day high within a monthly bullish channel, currently between 7.1320 and 7.0460. That said, RSI (14) line suggests a gradual upside while bears stay off the table unless the quote stays below the October 2022 swing low of around 7.0120.
Technical Levels: Supports and Resistances
USDCNH currently trading at 7.105 at the time of writing. Pair opened at 7.0856 and is trading with a change of 0.27% % .
| Overview | Overview.1 | |
|---|---|---|
| 0 | Today last price | 7.105 |
| 1 | Today Daily Change | 0.0194 |
| 2 | Today Daily Change % | 0.27% |
| 3 | Today daily open | 7.0856 |
The pair remains strongly bullish on the daily timeframe. It trades above its 20 SMA @ 6.994, 50 SMA 6.9315, 100 SMA @ 6.8856 and 200 SMA @ 6.9766.
| Trends | Trends.1 | |
|---|---|---|
| 0 | Daily SMA20 | 6.9940 |
| 1 | Daily SMA50 | 6.9315 |
| 2 | Daily SMA100 | 6.8856 |
| 3 | Daily SMA200 | 6.9766 |
The previous day high was 7.0912 while the previous day low was 7.0642. The daily 38.2% Fib levels comes at 7.0809, expected to provide support. Similarly, the daily 61.8% fib level is at 7.0746, expected to provide support.
Note the levels of interest below:
- Pivot support is noted at 7.0695, 7.0534, 7.0425
- Pivot resistance is noted at 7.0965, 7.1074, 7.1235
| Levels | Levels.1 |
|---|---|
| Previous Daily High | 7.0912 |
| Previous Daily Low | 7.0642 |
| Previous Weekly High | 7.0986 |
| Previous Weekly Low | 7.0152 |
| Previous Monthly High | 6.9508 |
| Previous Monthly Low | 6.8302 |
| Daily Fibonacci 38.2% | 7.0809 |
| Daily Fibonacci 61.8% | 7.0746 |
| Daily Pivot Point S1 | 7.0695 |
| Daily Pivot Point S2 | 7.0534 |
| Daily Pivot Point S3 | 7.0425 |
| Daily Pivot Point R1 | 7.0965 |
| Daily Pivot Point R2 | 7.1074 |
| Daily Pivot Point R3 | 7.1235 |
[/s2If]
Nehcap Expert Advisor
The NEHCAP MT4 EA is high quality professional trading system geared to generate returns without using GRID or martingales. Each trade has strict risk per trade parameter. The pairs under management include EURUSD, GBPUSD, AUDCAD, AUDNZD,GBPAUD, EURAUD, EURCAD, CHFJPY and many more.
The system is trading live: LIVE ACCOUNT TRACKING
You can run it free. Apply for a free trial and track our account. Buy the system or use profit share mechanism to generate returns on your MT4.
Join Our Telegram Group
")


