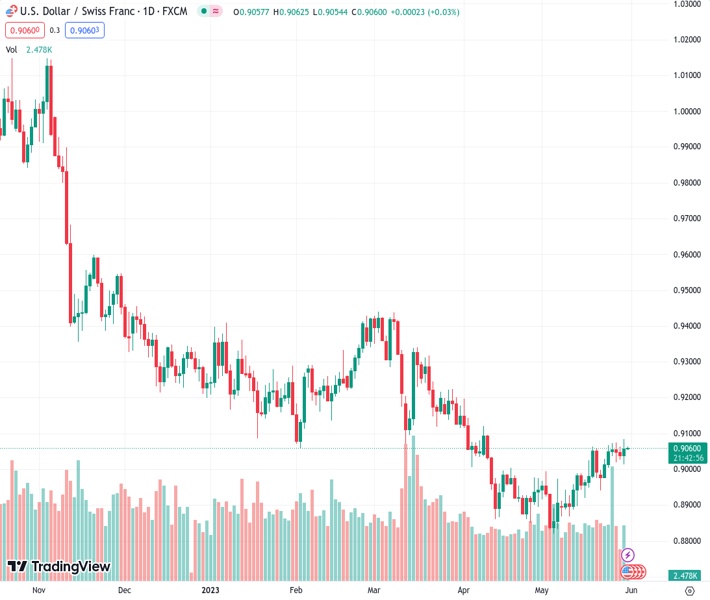
#USDCHF @ 0.90608 is looking to recapture the immediate resistance of 0.9080 despite the subdued USD Index. (Pivot Orderbook analysis)
…
This is a premium post.
[s2If !current_user_can(access_s2member_level4)]Please register for FREE REGISTER to read full post below containing analysis. In case of any error or you think you are not able to read the full post below, please email us at support#nehcap.com [lwa][/s2If] [s2If current_user_can(access_s2member_level1)]
- USD/CHF is looking to recapture the immediate resistance of 0.9080 despite the subdued USD Index.
- The Swiss Franc bulls witnessed immense selling pressure on Tuesday despite the release of upbeat Q1 GDP.
- USD/CHF is demonstrating a consolidation phase after delivering a breakout of the Wyckoff Accumulation pattern.
The pair currently trades last at 0.90608.
The previous day high was 0.9062 while the previous day low was 0.9028. The daily 38.2% Fib levels comes at 0.9041, expected to provide support. Similarly, the daily 61.8% fib level is at 0.9049, expected to provide support.
The USD/CHF pair has turned sideways around 0.9060 in the early Asian session after a V-shape recovery. The Swiss Franc asset is expected to recapture the crucial resistance of 0.9080 despite a subdued performance by the US Dollar Index (DXY).
Strength in the USD/CHF pair despite the sluggish USD index indicates that the Swiss Franc bulls are also weak. The Swiss Franc bulls witnessed immense selling pressure on Tuesday despite the release of upbeat Q1 Gross Domestic Product (GDP) data. Annual GDP matched expectations at 0.6% while quarterly GDP expanded by 0.3% while the street was anticipating an expansion of 0.1%.
Sheer volatility is anticipated from the US Dollar ahead of the release of the United States Automatic Data Processing (ADP) Employment data will be keenly watched. As per the consensus, the US economy added 170K jobs in May, lower than the prior addition of 296K. Later on Friday, US Nonfarm Payrolls (NFP) will release, which will provide comprehensive information about the US labor market.
USD/CHF is demonstrating a consolidation phase after delivering a breakout of the Wyckoff Accumulation pattern formed on a four-hour scale. Broadly, the Swiss franc asset is expected to display wider bullish ticks and heavy volume as bulls remain solid in the markup phase.
Currently, Relative Strength Index (RSI) (14) is oscillating in the 40.00-60.00 range, which indicates a lackluster performance. A confident break into the bullish range of 60.00-80.00 would strengthen US Dollar bulls.
Going forward, a decisive break above the immediate resistance plotted on May 30 high at 0.9084 will drive the asset toward March 28 low at 0.9137 followed by the round-level resistance of 0.9200.
In an alternate scenario, a downside move below May 16 low at 0.8929 will drag the asset toward April 14 low at 0.8867. A slippage below April 14 low will further drag the asset toward the Spring formation around May 04 low at 0.8820.
Technical Levels: Supports and Resistances
USDCHF currently trading at 0.9061 at the time of writing. Pair opened at 0.9045 and is trading with a change of 0.18 % .
| Overview | Overview.1 | |
|---|---|---|
| 0 | Today last price | 0.9061 |
| 1 | Today Daily Change | 0.0016 |
| 2 | Today Daily Change % | 0.1800 |
| 3 | Today daily open | 0.9045 |
The pair is trading above its 20 Daily moving average @ 0.8965, above its 50 Daily moving average @ 0.9009 , below its 100 Daily moving average @ 0.9135 and below its 200 Daily moving average @ 0.9387
| Trends | Trends.1 | |
|---|---|---|
| 0 | Daily SMA20 | 0.8965 |
| 1 | Daily SMA50 | 0.9009 |
| 2 | Daily SMA100 | 0.9135 |
| 3 | Daily SMA200 | 0.9387 |
The previous day high was 0.9062 while the previous day low was 0.9028. The daily 38.2% Fib levels comes at 0.9041, expected to provide support. Similarly, the daily 61.8% fib level is at 0.9049, expected to provide support.
Note the levels of interest below:
- Pivot support is noted at 0.9028, 0.901, 0.8993
- Pivot resistance is noted at 0.9062, 0.9079, 0.9096
| Levels | Levels.1 |
|---|---|
| Previous Daily High | 0.9062 |
| Previous Daily Low | 0.9028 |
| Previous Weekly High | 0.9075 |
| Previous Weekly Low | 0.8941 |
| Previous Monthly High | 0.9198 |
| Previous Monthly Low | 0.8852 |
| Daily Fibonacci 38.2% | 0.9041 |
| Daily Fibonacci 61.8% | 0.9049 |
| Daily Pivot Point S1 | 0.9028 |
| Daily Pivot Point S2 | 0.9010 |
| Daily Pivot Point S3 | 0.8993 |
| Daily Pivot Point R1 | 0.9062 |
| Daily Pivot Point R2 | 0.9079 |
| Daily Pivot Point R3 | 0.9096 |
[/s2If]
Nehcap Expert Advisor
The NEHCAP MT4 EA is high quality professional trading system geared to generate returns without using GRID or martingales. Each trade has strict risk per trade parameter. The pairs under management include EURUSD, GBPUSD, AUDCAD, AUDNZD,GBPAUD, EURAUD, EURCAD, CHFJPY and many more.
The system is trading live: LIVE ACCOUNT TRACKING
You can run it free. Apply for a free trial and track our account. Buy the system or use profit share mechanism to generate returns on your MT4.
Join Our Telegram Group
")


