#USDCAD @ 1.35769 slides in Asia as US Dollar bears move in. (Pivot Orderbook analysis)
…
This is a premium post.
[s2If !current_user_can(access_s2member_level4)]Please register for FREE REGISTER to read full post below containing analysis. In case of any error or you think you are not able to read the full post below, please email us at support#nehcap.com [lwa][/s2If] [s2If current_user_can(access_s2member_level1)]
- USD/CAD slides in Asia as US Dollar bears move in.
- US debt ceiling, US jobs and Canadian GDP in focus.
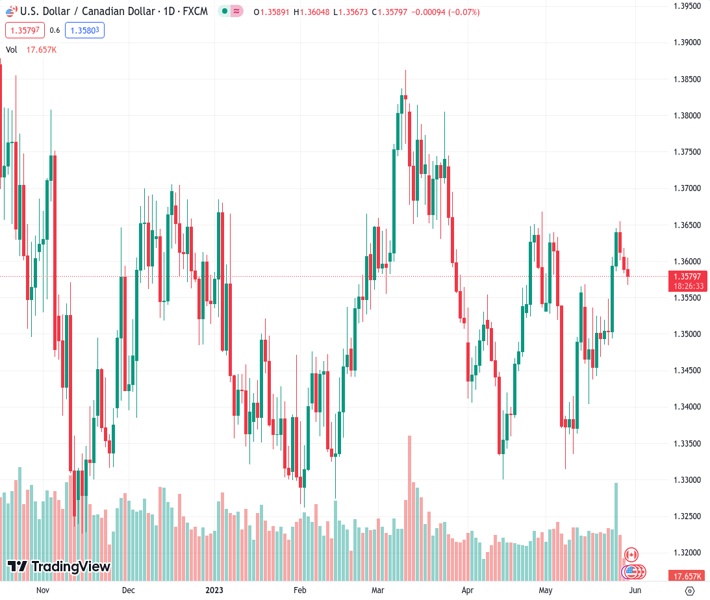
The pair currently trades last at 1.35769.
The previous day high was 1.3623 while the previous day low was 1.3583. The daily 38.2% Fib levels comes at 1.3598, expected to provide resistance. Similarly, the daily 61.8% fib level is at 1.3608, expected to provide resistance.
USD/CAD is under pressure in Asia with the CAD clawing back some recent declines, as a deal to temporarily suspend the U.S. debt ceiling boosted investor sentiment. USDCAD was trading 0.12% lower at 1.3572 after moving in a range of 1.3584 to 1.3618 on Monday around its weakest intraday level since April 28 at 1.3654.
The Greenback, as per the DXY index, dropped on Tuesday against a basket of major currencies, although remains news of its two-month peak in the 104.40s. A deal over the US debt ceiling has lifted risk sentiment and now traders await to see how it goes through a process in Congress.
There are that a handful of hard-right Republican lawmakers will oppose a deal to raise the United States’ $31.4 trillion debt ceiling meaning it will be a challenge to get the package through the Republican-controlled House of Representatives and Democratic-controlled Senate before the limit is reached. On Friday, US Treasury Secretary Janet Yellen said the government would default if Congress did not increase the debt ceiling by June 5. Meanwhile, longer-dated US Treasuries rallied in Asia on Tuesday on the debt ceiling deal.
As for the Federal Reserve sentiment, markets are pricing in a 60% chance of a 25 basis-point hike in June, compared with a 26% chance a week earlier, according to CME FedWatch tool. Traders will look at Friday’s job data and US Nonfarm payrolls likely slowed modestly in May, advancing at a still strong 200k+ pace for a second consecutive month, analysts at TD Securities said.
´´We also look for the UE rate to stay unchanged at a historical low of 3.4%, and for wage growth to print 0.3% MoM (4.4% YoY). Conversely, we look for the ISM mfg index to improve modestly, but to still signal contraction for the sector in May,´´ the analysts concluded.
Looking ahead to the domestic week, Canadian Gross Domestic Product data is due for release on Wednesday and there are expectations that the economy grew at an annualized rate of 2.5% in the first quarter. This comes ahead of next week´s interest rate decision by the Bank of Canada. Markets are pricing a roughly 30% chance of the central bank hiking its benchmark rate for the first time since January.
Technical Levels: Supports and Resistances
USDCAD currently trading at 1.3574 at the time of writing. Pair opened at 1.3591 and is trading with a change of -0.13 % .
| Overview | Overview.1 | |
|---|---|---|
| 0 | Today last price | 1.3574 |
| 1 | Today Daily Change | -0.0017 |
| 2 | Today Daily Change % | -0.1300 |
| 3 | Today daily open | 1.3591 |
The pair remains strongly bullish on the daily timeframe. It trades above its 20 SMA @ 1.351, 50 SMA 1.3524, 100 SMA @ 1.3513 and 200 SMA @ 1.3496.
| Trends | Trends.1 | |
|---|---|---|
| 0 | Daily SMA20 | 1.3510 |
| 1 | Daily SMA50 | 1.3524 |
| 2 | Daily SMA100 | 1.3513 |
| 3 | Daily SMA200 | 1.3496 |
The previous day high was 1.3623 while the previous day low was 1.3583. The daily 38.2% Fib levels comes at 1.3598, expected to provide resistance. Similarly, the daily 61.8% fib level is at 1.3608, expected to provide resistance.
Note the levels of interest below:
- Pivot support is noted at 1.3575, 1.3559, 1.3535
- Pivot resistance is noted at 1.3615, 1.3639, 1.3655
| Levels | Levels.1 |
|---|---|
| Previous Daily High | 1.3623 |
| Previous Daily Low | 1.3583 |
| Previous Weekly High | 1.3655 |
| Previous Weekly Low | 1.3485 |
| Previous Monthly High | 1.3668 |
| Previous Monthly Low | 1.3301 |
| Daily Fibonacci 38.2% | 1.3598 |
| Daily Fibonacci 61.8% | 1.3608 |
| Daily Pivot Point S1 | 1.3575 |
| Daily Pivot Point S2 | 1.3559 |
| Daily Pivot Point S3 | 1.3535 |
| Daily Pivot Point R1 | 1.3615 |
| Daily Pivot Point R2 | 1.3639 |
| Daily Pivot Point R3 | 1.3655 |
[/s2If]
Nehcap Expert Advisor
The NEHCAP MT4 EA is high quality professional trading system geared to generate returns without using GRID or martingales. Each trade has strict risk per trade parameter. The pairs under management include EURUSD, GBPUSD, AUDCAD, AUDNZD,GBPAUD, EURAUD, EURCAD, CHFJPY and many more.
The system is trading live: LIVE ACCOUNT TRACKING
You can run it free. Apply for a free trial and track our account. Buy the system or use profit share mechanism to generate returns on your MT4.
Join Our Telegram Group
")


