#NZDUSD @ 0.60545 picks up bids within three-day-old descending triangle., @nehcap view: Further downside expected (Pivot Orderbook analysis)
…
This is a premium post.
[s2If !current_user_can(access_s2member_level4)]Please register for FREE REGISTER to read full post below containing analysis. In case of any error or you think you are not able to read the full post below, please email us at support#nehcap.com [lwa][/s2If] [s2If current_user_can(access_s2member_level1)]
- NZD/USD picks up bids within three-day-old descending triangle.
- RSI’s rebound from oversold territory, bullish MACD signals suggest further corrective bounce of the Kiwi pair.
- Buyers to stay skeptical below 0.6250 resistance confluence.
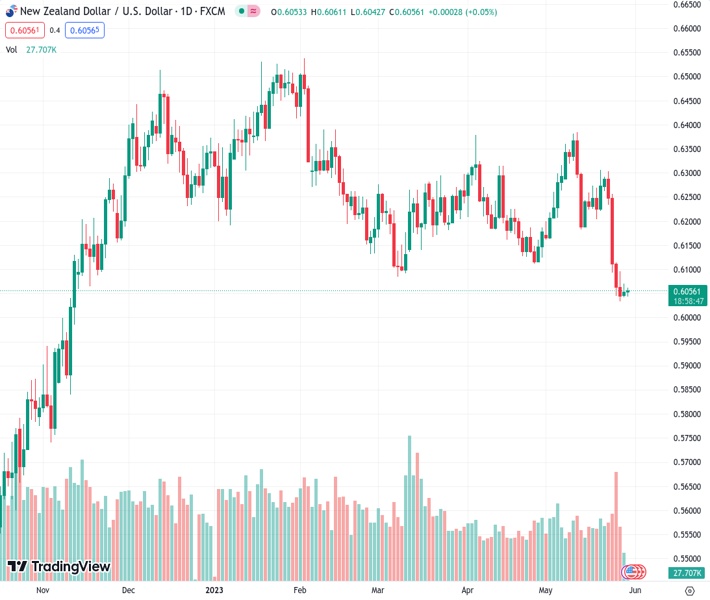
The pair currently trades last at 0.60545.
The previous day high was 0.6072 while the previous day low was 0.6044. The daily 38.2% Fib levels comes at 0.6055, expected to provide resistance. Similarly, the daily 61.8% fib level is at 0.6061, expected to provide resistance.
NZD/USD prints mild gains around 0.6050 inside a bullish triangle formation portrayed at the yearly low. In doing so, the Kiwi pair justifies the RSI (14) line’s recovery from the oversold territory, as well as the bullish MACD signals, during early Tuesday.
As a result, the pair buyers may witness the further recovery of the quote towards the stated triangle’s top line, surrounding 0.6070 at the latest, ahead of poking the 0.6100 round figure.
Following that, a convergence of the previous support line stretched from late April and a 13-day-old descending resistance line, around 0.6250 by the press time, will be in the spotlight as it holds the key for the NZD/USD bull’s dominance.
It should be noted that the mid-May swing low around 0.6180-85 can act as an intermediate halt between 0.6100 and 0.6250.
Alternatively, a downside break of the stated triangle’s bottom line of around 0.6040 can quickly fetch the quote towards the 0.6000 psychological magnet.
Should the NZD/USD pair remains weak past the 0.6000 round figure, it becomes vulnerable to testing the early October 2022 peak of 0.5815.
Overall, NZD/USD stays bearish unless breaking the 0.6250 key hurdle.
Trend: Further downside expected
Technical Levels: Supports and Resistances
NZDUSD currently trading at 0.6058 at the time of writing. Pair opened at 0.6054 and is trading with a change of 0.07% % .
| Overview | Overview.1 | |
|---|---|---|
| 0 | Today last price | 0.6058 |
| 1 | Today Daily Change | 0.0004 |
| 2 | Today Daily Change % | 0.07% |
| 3 | Today daily open | 0.6054 |
The pair remains strongly bearish on the daily time frame. It trades below the 20 SMA @ 0.6221, 50 SMA 0.6217, 100 SMA @ 0.6264 and 200 SMA @ 0.6153.
| Trends | Trends.1 | |
|---|---|---|
| 0 | Daily SMA20 | 0.6221 |
| 1 | Daily SMA50 | 0.6217 |
| 2 | Daily SMA100 | 0.6264 |
| 3 | Daily SMA200 | 0.6153 |
The previous day high was 0.6072 while the previous day low was 0.6044. The daily 38.2% Fib levels comes at 0.6055, expected to provide resistance. Similarly, the daily 61.8% fib level is at 0.6061, expected to provide resistance.
Note the levels of interest below:
- Pivot support is noted at 0.6041, 0.6029, 0.6013
- Pivot resistance is noted at 0.6069, 0.6085, 0.6097
| Levels | Levels.1 |
|---|---|
| Previous Daily High | 0.6072 |
| Previous Daily Low | 0.6044 |
| Previous Weekly High | 0.6303 |
| Previous Weekly Low | 0.6032 |
| Previous Monthly High | 0.6389 |
| Previous Monthly Low | 0.6111 |
| Daily Fibonacci 38.2% | 0.6055 |
| Daily Fibonacci 61.8% | 0.6061 |
| Daily Pivot Point S1 | 0.6041 |
| Daily Pivot Point S2 | 0.6029 |
| Daily Pivot Point S3 | 0.6013 |
| Daily Pivot Point R1 | 0.6069 |
| Daily Pivot Point R2 | 0.6085 |
| Daily Pivot Point R3 | 0.6097 |
[/s2If]
Nehcap Expert Advisor
The NEHCAP MT4 EA is high quality professional trading system geared to generate returns without using GRID or martingales. Each trade has strict risk per trade parameter. The pairs under management include EURUSD, GBPUSD, AUDCAD, AUDNZD,GBPAUD, EURAUD, EURCAD, CHFJPY and many more.
The system is trading live: LIVE ACCOUNT TRACKING
You can run it free. Apply for a free trial and track our account. Buy the system or use profit share mechanism to generate returns on your MT4.
Join Our Telegram Group
")


