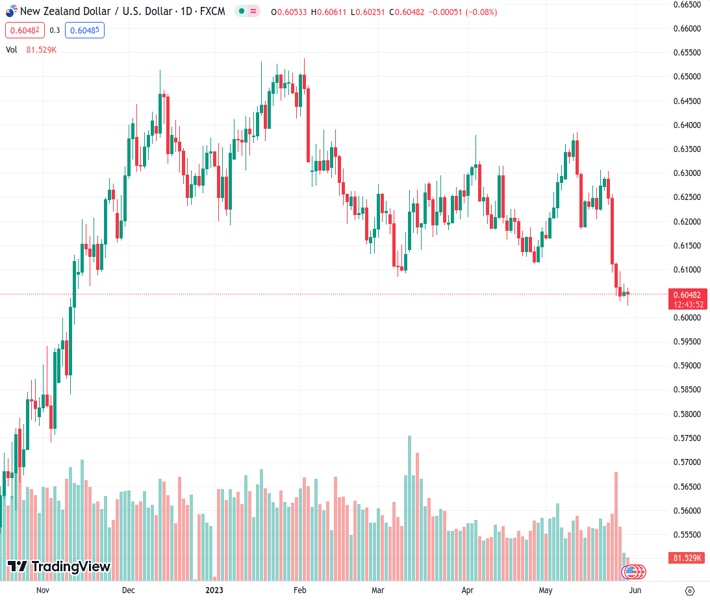
#NZDUSD @ 0.60467 manages to recover a bid from a fresh YTD low touched earlier this Tuesday. (Pivot Orderbook analysis)
…
This is a premium post.
[s2If !current_user_can(access_s2member_level4)]Please register for FREE REGISTER to read full post below containing analysis. In case of any error or you think you are not able to read the full post below, please email us at support#nehcap.com [lwa][/s2If] [s2If current_user_can(access_s2member_level1)]
- NZD/USD manages to recover a bid from a fresh YTD low touched earlier this Tuesday.
- A positive risk tone, retreating US bond yields cap the USD and lend support to the pair.
- The fundamental backdrop warrants caution before positioning for any meaningful rally.
The pair currently trades last at 0.60467.
The previous day high was 0.6072 while the previous day low was 0.6044. The daily 38.2% Fib levels comes at 0.6055, expected to provide resistance. Similarly, the daily 61.8% fib level is at 0.6061, expected to provide resistance.
The NZD/USD pair struggles to capitalize on the previous day’s modest gains and meets with a fresh supply on Tuesday, hitting a fresh low since November 2022. Spot prices, however, manage to recover a few pips and trade just below mid-0.6000s during the early European session, still down nearly 0.20% for the day.
The New Zealand Dollar (NZD) continues to be undermined by the Reserve Bank of New Zealand’s (RBNZ) explicit signal last week that it was done with its most aggressive hiking cycle since 1999. The US Dollar (USD), on the other hand, stands tall near a two-and-half-month high amid firming expectations that the Federal Reserve (Fed) will keep interest rates higher for longer and further contributes to the offered tone surrounding the NZD/USD pair.
In fact, the current market pricing indicates a greater chance of another 25 bps lift-off at the next FOMC policy meeting in June to combat stick inflation. The expectations were lifted by the recent hawkish remarks by several policymakers and the fact that the Fed’s preferred inflation gauge, the Core PCE Price Index unexpectedly rose in April. This, in turn, continues to act as a tailwind for the Greenback and exerts some downward pressure on the NZD/USD pair.
That said, a modest pullback in the US Treasury bond yields, along with a positive risk tone, amid the optimism over raising the US debt ceiling, cap gains the safe-haven buck. This, in turn, assists the NZD/USD pair to find support near the 0.6025 area. Any meaningful recovery, however, seems elusive in the wake of worries about a global economic downturn and the worsening US-China ties, which tend to dent demand for antipodean currencies, including the Kiwi.
Market participants now look forward to the release of the Conference Board’s US Consumer Confidence Index for a fresh impetus later during the early North American session. This, along with the US bond yields and the broader risk sentiment, will influence the USD and produce short-term trading opportunities around the NZD/USD pair. The fundamental backdrop, meanwhile, suggests that the path of least resistance for spot prices is to the downside.
Technical Levels: Supports and Resistances
NZDUSD currently trading at 0.6048 at the time of writing. Pair opened at 0.6054 and is trading with a change of -0.1 % .
| Overview | Overview.1 | |
|---|---|---|
| 0 | Today last price | 0.6048 |
| 1 | Today Daily Change | -0.0006 |
| 2 | Today Daily Change % | -0.1000 |
| 3 | Today daily open | 0.6054 |
The pair remains strongly bearish on the daily time frame. It trades below the 20 SMA @ 0.6221, 50 SMA 0.6217, 100 SMA @ 0.6264 and 200 SMA @ 0.6153.
| Trends | Trends.1 | |
|---|---|---|
| 0 | Daily SMA20 | 0.6221 |
| 1 | Daily SMA50 | 0.6217 |
| 2 | Daily SMA100 | 0.6264 |
| 3 | Daily SMA200 | 0.6153 |
The previous day high was 0.6072 while the previous day low was 0.6044. The daily 38.2% Fib levels comes at 0.6055, expected to provide resistance. Similarly, the daily 61.8% fib level is at 0.6061, expected to provide resistance.
Note the levels of interest below:
- Pivot support is noted at 0.6041, 0.6029, 0.6013
- Pivot resistance is noted at 0.6069, 0.6085, 0.6097
| Levels | Levels.1 |
|---|---|
| Previous Daily High | 0.6072 |
| Previous Daily Low | 0.6044 |
| Previous Weekly High | 0.6303 |
| Previous Weekly Low | 0.6032 |
| Previous Monthly High | 0.6389 |
| Previous Monthly Low | 0.6111 |
| Daily Fibonacci 38.2% | 0.6055 |
| Daily Fibonacci 61.8% | 0.6061 |
| Daily Pivot Point S1 | 0.6041 |
| Daily Pivot Point S2 | 0.6029 |
| Daily Pivot Point S3 | 0.6013 |
| Daily Pivot Point R1 | 0.6069 |
| Daily Pivot Point R2 | 0.6085 |
| Daily Pivot Point R3 | 0.6097 |
[/s2If]
Nehcap Expert Advisor
The NEHCAP MT4 EA is high quality professional trading system geared to generate returns without using GRID or martingales. Each trade has strict risk per trade parameter. The pairs under management include EURUSD, GBPUSD, AUDCAD, AUDNZD,GBPAUD, EURAUD, EURCAD, CHFJPY and many more.
The system is trading live: LIVE ACCOUNT TRACKING
You can run it free. Apply for a free trial and track our account. Buy the system or use profit share mechanism to generate returns on your MT4.
Join Our Telegram Group
")


