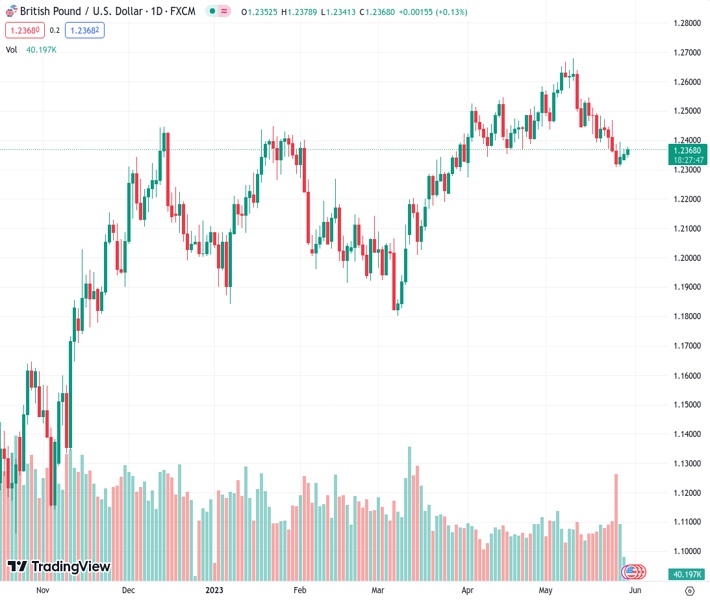
#GBPUSD @ 1.23695 renews intraday high during three-day rebound from monthly low. (Pivot Orderbook analysis)
…
This is a premium post.
[s2If !current_user_can(access_s2member_level4)]Please register for FREE REGISTER to read full post below containing analysis. In case of any error or you think you are not able to read the full post below, please email us at support#nehcap.com [lwa][/s2If] [s2If current_user_can(access_s2member_level1)]
- GBP/USD renews intraday high during three-day rebound from monthly low.
- UK shop price inflation jumps to record high, per BRC.
- Optimism surrounding US debt ceiling deal prod US Dollar bulls ahead of mid-tier US data.
- Risk catalysts are the key for clear directions amid full markets’ return after Monday’s holidays in major economies.
The pair currently trades last at 1.23695.
The previous day high was 1.2372 while the previous day low was 1.2335. The daily 38.2% Fib levels comes at 1.2358, expected to provide support. Similarly, the daily 61.8% fib level is at 1.2349, expected to provide support.
GBP/USD prints a three-day uptrend as bulls approach the 1.2400 resistance confluence during very early Tuesday morning in Europe, refreshing intraday high to around 1.2370 by the press time.
In doing so, the Cable pair not only cheers the US Dollar’s pullback amid the risk-on mood but also benefits from the hawkish hopes surrounding the Bank of England (BoE). It’s worth noting that the Pound Sterling pair dropped to the lowest levels in early April in the last week.
Earlier in the day, the British Retail Consortium (BRC) released Shop Price Index figures for April while conveying a record pressure on inflation due to the actual outcome. That said, the BRC Shop Price Index rises to 9.0% in April from 8.8% prior. It’s worth noting that BoE policymaker Jonathan Haskel said on Friday, “If we do see evidence of more inflation persistence, we will tighten policy.”
On the other hand, the US Dollar Index (DXY) reverses from a six-month-old resistance line to print the first daily loss in seven around 104.10 as firmer sentiment weigh on the US Dollar’s haven demand.
That said, the weekend news suggesting the US policymakers’ deal on the debt-ceiling extension to January 2025 allowed traders to remain hopeful after a long weekend in major economies. However, some of the policymakers, mostly Republicans, are against the compromises made to their previous demands to reach the deal. The policymakers also show readiness to challenge the agreement in the House, as well as in the Senate, which in turn prods the market’s previous risk-on mood and keeps the US Dollar on the front foot. “A handful of hard-right Republican lawmakers said on Monday they would oppose a deal to raise the United States’ $31.4 trillion debt ceiling, in a sign that the bipartisan agreement could face a rocky path through Congress before the US runs out of money next week,” said Reuters.
Against this backdrop, the S&500 Futures print mild gains around 4,220 after retreating from the yearly high the previous day whereas the US Treasury yields drop by the press time.
Looking ahead, Wednesday’s US House voting on the debt-ceiling agreement and the Senate’s approval for the same before June 05, as well as Friday’s US jobs report, gains major attention. However, today’s US CB Consumer Confidence for May, expected to ease from 101.30 prior readings, will be important to determine the Cable pair’s intraday moves.
GBP/USD picks up bids inside a three-week-old bearish channel, recently approaching the 1.2400 resistance confluence comprising the 10-DMA and the stated channel’s top line.
Technical Levels: Supports and Resistances
GBPUSD currently trading at 1.2372 at the time of writing. Pair opened at 1.2356 and is trading with a change of 0.13% % .
| Overview | Overview.1 | |
|---|---|---|
| 0 | Today last price | 1.2372 |
| 1 | Today Daily Change | 0.0016 |
| 2 | Today Daily Change % | 0.13% |
| 3 | Today daily open | 1.2356 |
The pair is trading below its 20 Daily moving average @ 1.2483, below its 50 Daily moving average @ 1.2437 , above its 100 Daily moving average @ 1.229 and above its 200 Daily moving average @ 1.1981
| Trends | Trends.1 | |
|---|---|---|
| 0 | Daily SMA20 | 1.2483 |
| 1 | Daily SMA50 | 1.2437 |
| 2 | Daily SMA100 | 1.2290 |
| 3 | Daily SMA200 | 1.1981 |
The previous day high was 1.2372 while the previous day low was 1.2335. The daily 38.2% Fib levels comes at 1.2358, expected to provide support. Similarly, the daily 61.8% fib level is at 1.2349, expected to provide support.
Note the levels of interest below:
- Pivot support is noted at 1.2337, 1.2318, 1.23
- Pivot resistance is noted at 1.2373, 1.2391, 1.241
| Levels | Levels.1 |
|---|---|
| Previous Daily High | 1.2372 |
| Previous Daily Low | 1.2335 |
| Previous Weekly High | 1.2472 |
| Previous Weekly Low | 1.2308 |
| Previous Monthly High | 1.2584 |
| Previous Monthly Low | 1.2275 |
| Daily Fibonacci 38.2% | 1.2358 |
| Daily Fibonacci 61.8% | 1.2349 |
| Daily Pivot Point S1 | 1.2337 |
| Daily Pivot Point S2 | 1.2318 |
| Daily Pivot Point S3 | 1.2300 |
| Daily Pivot Point R1 | 1.2373 |
| Daily Pivot Point R2 | 1.2391 |
| Daily Pivot Point R3 | 1.2410 |
[/s2If]
Nehcap Expert Advisor
The NEHCAP MT4 EA is high quality professional trading system geared to generate returns without using GRID or martingales. Each trade has strict risk per trade parameter. The pairs under management include EURUSD, GBPUSD, AUDCAD, AUDNZD,GBPAUD, EURAUD, EURCAD, CHFJPY and many more.
The system is trading live: LIVE ACCOUNT TRACKING
You can run it free. Apply for a free trial and track our account. Buy the system or use profit share mechanism to generate returns on your MT4.
Join Our Telegram Group
")


