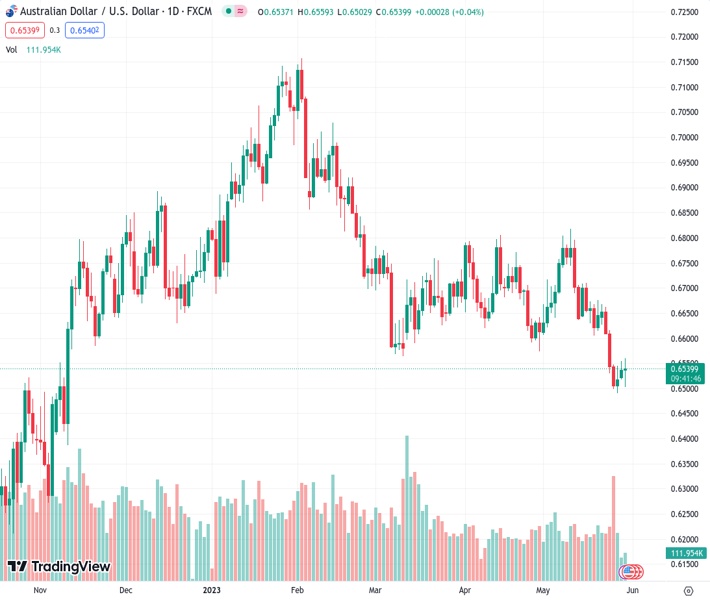
#AUDUSD @ 0.65418 reverses an intraday slide amid a modest USD pullback from over a two-month high. (Pivot Orderbook analysis)
…
This is a premium post.
[s2If !current_user_can(access_s2member_level4)]Please register for FREE REGISTER to read full post below containing analysis. In case of any error or you think you are not able to read the full post below, please email us at support#nehcap.com [lwa][/s2If] [s2If current_user_can(access_s2member_level1)]
- AUD/USD reverses an intraday slide amid a modest USD pullback from over a two-month high.
- Retreating US bond yields and a positive risk tone prompts some profit-taking around the USD.
- Bets for more Fed rate hikes to act as a tailwind for the buck and cap any upside for the major.
The pair currently trades last at 0.65418.
The previous day high was 0.6554 while the previous day low was 0.6514. The daily 38.2% Fib levels comes at 0.6539, expected to provide support. Similarly, the daily 61.8% fib level is at 0.653, expected to provide support.
The AUD/USD pair attracts some dip-buying near the 0.6500 psychological mark on Tuesday and builds on its steady intraday ascent through the first half of the European session. Spot prices, however, lack bullish conviction and currently trade around the 0.6540-0.6535 region, nearly unchanged for the day and below a multi-day high touched earlier today.
A combination of factors prompts traders to take some profits off their US Dollar (USD) bullish positions, especially after the recent runup to over a two-month high, which, in turn, is seen lending some support to the AUD/USD pair. A tentative deal to raise the $31.4 trillion debt ceiling and avert an unprecedented American default boosts investors’ confidence, which is evident from a generally positive tone around the equity markets. This, along with a sharp intraday slide in the US Treasury bond yields, undermines the safe-haven buck.
That said, growing worries about slowing global economic growth, particularly in China, and fresh US-China tensions might cap any optimism in the markets. It is worth recalling that data from China recently showed that the world’s second-largest economy underperformed in April. Furthermore, China declined a request for a meeting between US defence secretary Lloyd Austin and Chinese defence minister Li Shangfu at a forum in Singapore later this week, fueling fears of worsening ties between the world’s two largest economies.
Moreover, the downside for the USD is likely to remain limited amid expectations that the Federal Reserve will keep interest rates higher for longer. In fact, the markets are now pricing in a greater chance of another 25 bps lift-off at the next FOMC policy meeting in June. This, along with speculations that the Reserve Bank of Australia (RBA) might refrain from hiking in June, bolstered by softer domestic data, should contribute to capping the AUD/USD pair and suggests that the path of least resistance for spot prices is to the downside.
Market participants now look to the release of the Conference Board’s US Consumer Confidence Index, due later during the early North American session. This, along with the US bond yields and the broader risk sentiment, will influence the USD price dynamics and produce short-term trading opportunities around the AUD/USD pair. The focus will then shift to RBA Governor Philip Lowe’s speech, the monthly Australian consumer inflation figures and the official Chinese PMI prints, due during the Asian session on Wednesday.
Technical Levels: Supports and Resistances
AUDUSD currently trading at 0.6542 at the time of writing. Pair opened at 0.6538 and is trading with a change of 0.06 % .
| Overview | Overview.1 | |
|---|---|---|
| 0 | Today last price | 0.6542 |
| 1 | Today Daily Change | 0.0004 |
| 2 | Today Daily Change % | 0.0600 |
| 3 | Today daily open | 0.6538 |
The pair remains strongly bearish on the daily time frame. It trades below the 20 SMA @ 0.6655, 50 SMA 0.6673, 100 SMA @ 0.677 and 200 SMA @ 0.6703.
| Trends | Trends.1 | |
|---|---|---|
| 0 | Daily SMA20 | 0.6655 |
| 1 | Daily SMA50 | 0.6673 |
| 2 | Daily SMA100 | 0.6770 |
| 3 | Daily SMA200 | 0.6703 |
The previous day high was 0.6554 while the previous day low was 0.6514. The daily 38.2% Fib levels comes at 0.6539, expected to provide support. Similarly, the daily 61.8% fib level is at 0.653, expected to provide support.
Note the levels of interest below:
- Pivot support is noted at 0.6517, 0.6496, 0.6477
- Pivot resistance is noted at 0.6557, 0.6575, 0.6596
| Levels | Levels.1 |
|---|---|
| Previous Daily High | 0.6554 |
| Previous Daily Low | 0.6514 |
| Previous Weekly High | 0.6668 |
| Previous Weekly Low | 0.6490 |
| Previous Monthly High | 0.6806 |
| Previous Monthly Low | 0.6574 |
| Daily Fibonacci 38.2% | 0.6539 |
| Daily Fibonacci 61.8% | 0.6530 |
| Daily Pivot Point S1 | 0.6517 |
| Daily Pivot Point S2 | 0.6496 |
| Daily Pivot Point S3 | 0.6477 |
| Daily Pivot Point R1 | 0.6557 |
| Daily Pivot Point R2 | 0.6575 |
| Daily Pivot Point R3 | 0.6596 |
[/s2If]
Nehcap Expert Advisor
The NEHCAP MT4 EA is high quality professional trading system geared to generate returns without using GRID or martingales. Each trade has strict risk per trade parameter. The pairs under management include EURUSD, GBPUSD, AUDCAD, AUDNZD,GBPAUD, EURAUD, EURCAD, CHFJPY and many more.
The system is trading live: LIVE ACCOUNT TRACKING
You can run it free. Apply for a free trial and track our account. Buy the system or use profit share mechanism to generate returns on your MT4.
Join Our Telegram Group
")


