#AUDUSD @ 0.65164 The ends with substantial losses, nearing YTD lows, weighed by disputes amongst Republicans. (Pivot Orderbook analysis)
…
This is a premium post.
[s2If !current_user_can(access_s2member_level4)]Please register for FREE REGISTER to read full post below containing analysis. In case of any error or you think you are not able to read the full post below, please email us at support#nehcap.com [lwa][/s2If] [s2If current_user_can(access_s2member_level1)]
- The AUD/USD ends with substantial losses, nearing YTD lows, weighed by disputes amongst Republicans.
- Political discussions surrounding the US debt ceiling and potential leadership change add a sour note to market sentiment.
- Investors are eyeing upcoming inflation data, Private Sector, and Housing Credit from Australia and the Chicago PMI and JOLTs report from the US for further market direction.
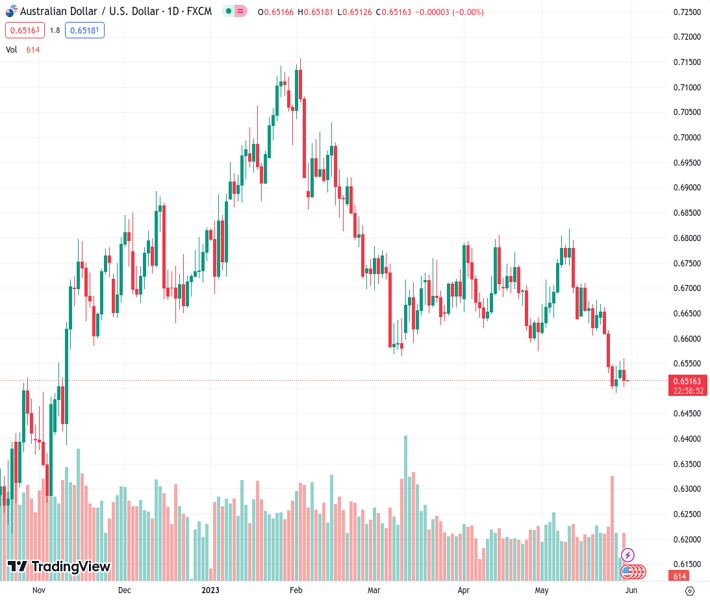
The pair currently trades last at 0.65164.
The previous day high was 0.6554 while the previous day low was 0.6514. The daily 38.2% Fib levels comes at 0.6539, expected to provide resistance. Similarly, the daily 61.8% fib level is at 0.653, expected to provide resistance.
AUD/USD is set to finish Tuesday’s session with substantial losses, snapping two days of gains spurred by mixed market sentiment. Factors like Republicans opposing the US debt-ceiling agreement, alongside falling US Treasury bond yields, cushioned the AUD/USD’s fall. However, the AUD/USD is still hovering around the year-to-date (YTD) lows of 0.6510s.
US equities finished the session mixed, as debt-ceiling discussions continued amongst Republicans looking to oust Kevin McCarthy as House Speaker. That, alongside falling US bond yields, turned market sentiment sour, weighing on Wall Street and US Treasury bond yields.
Talking about data, the US economic agenda revealed housing prices that advanced more than estimates but were ignored by market participants. Later, the US Conference Board (CB) showed that Consumer Confidence in May slowed to 102.3, above calculations but below April’s 103.7. “Consumer confidence declined in May as consumers’ view of current conditions became somewhat less upbeat while their expectations remained gloomy,” said Ataman Ozyildirim, Senior Director, Economics at The Conference Board.
In the meantime, the Dallas Fed reported that manufacturing activity in their area plunged to -29.1, beneath the prior’s month -23.4 drop, suggesting an ongoing deterioration in the Dallas Fed regional area.
On Wednesday, the Australian economic docket will feature inflation data, Private Sector, and Housing Credit, which could shed some light on the status of households. The Chicago PMI and the JOLTs report will update the economy’s position in the US.
Technical Levels: Supports and Resistances
AUDUSD currently trading at 0.6516 at the time of writing. Pair opened at 0.6538 and is trading with a change of -0.34 % .
| Overview | Overview.1 | |
|---|---|---|
| 0 | Today last price | 0.6516 |
| 1 | Today Daily Change | -0.0022 |
| 2 | Today Daily Change % | -0.3400 |
| 3 | Today daily open | 0.6538 |
The pair remains strongly bearish on the daily time frame. It trades below the 20 SMA @ 0.6655, 50 SMA 0.6673, 100 SMA @ 0.677 and 200 SMA @ 0.6703.
| Trends | Trends.1 | |
|---|---|---|
| 0 | Daily SMA20 | 0.6655 |
| 1 | Daily SMA50 | 0.6673 |
| 2 | Daily SMA100 | 0.6770 |
| 3 | Daily SMA200 | 0.6703 |
The previous day high was 0.6554 while the previous day low was 0.6514. The daily 38.2% Fib levels comes at 0.6539, expected to provide resistance. Similarly, the daily 61.8% fib level is at 0.653, expected to provide resistance.
Note the levels of interest below:
- Pivot support is noted at 0.6517, 0.6496, 0.6477
- Pivot resistance is noted at 0.6557, 0.6575, 0.6596
| Levels | Levels.1 |
|---|---|
| Previous Daily High | 0.6554 |
| Previous Daily Low | 0.6514 |
| Previous Weekly High | 0.6668 |
| Previous Weekly Low | 0.6490 |
| Previous Monthly High | 0.6806 |
| Previous Monthly Low | 0.6574 |
| Daily Fibonacci 38.2% | 0.6539 |
| Daily Fibonacci 61.8% | 0.6530 |
| Daily Pivot Point S1 | 0.6517 |
| Daily Pivot Point S2 | 0.6496 |
| Daily Pivot Point S3 | 0.6477 |
| Daily Pivot Point R1 | 0.6557 |
| Daily Pivot Point R2 | 0.6575 |
| Daily Pivot Point R3 | 0.6596 |
[/s2If]
Nehcap Expert Advisor
The NEHCAP MT4 EA is high quality professional trading system geared to generate returns without using GRID or martingales. Each trade has strict risk per trade parameter. The pairs under management include EURUSD, GBPUSD, AUDCAD, AUDNZD,GBPAUD, EURAUD, EURCAD, CHFJPY and many more.
The system is trading live: LIVE ACCOUNT TRACKING
You can run it free. Apply for a free trial and track our account. Buy the system or use profit share mechanism to generate returns on your MT4.
Join Our Telegram Group
")


