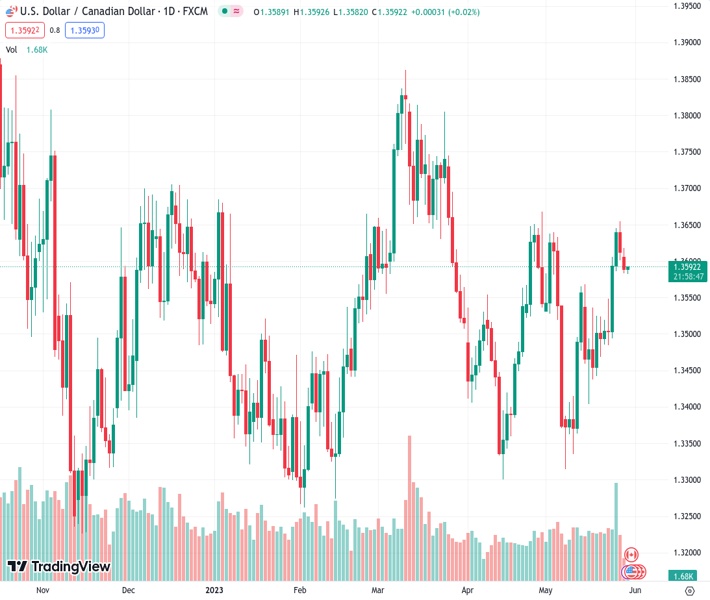
#USDCAD @ 1.35922 is oscillating in a narrow range below 1.3600 amid a quiet market mood. (Pivot Orderbook analysis)
…
This is a premium post.
[s2If !current_user_can(access_s2member_level4)]Please register for FREE REGISTER to read full post below containing analysis. In case of any error or you think you are not able to read the full post below, please email us at support#nehcap.com [lwa][/s2If] [s2If current_user_can(access_s2member_level1)]
- USD/CAD is oscillating in a narrow range below 1.3600 amid a quiet market mood.
- This week, US Employment-linked economic indicators will keep investors busy.
- USD/CAD is hovering near the neckline of the Head and Shoulder chart pattern around 1.3584.
The pair currently trades last at 1.35922.
The previous day high was 1.3655 while the previous day low was 1.3601. The daily 38.2% Fib levels comes at 1.3622, expected to provide resistance. Similarly, the daily 61.8% fib level is at 1.3634, expected to provide resistance.
The USD/CAD pair is juggling in a narrow range below the round-level resistance of 1.3600 in the early Tokyo session. The Loonie asset is expected to display a power-pack action as investors would remain highly active after an extended weekend.
As US debt-ceiling raise proposal is finally going to Congress for approval before June 05, investors would shift their focus towards United States Employment-linked economic indicators. After Wednesday’s JOLTS Job Openings data, investors will focus on Thursday’s Automatic Data Processing (ADP) Employment Change and finally on Friday’s Nonfarm Payrolls (NFP) data.
The Canadian Dollar is expected to remain on the tenterhooks amid the release of the Q1 Gross Domestic Product (GDP) data, which will release on Wednesday.
Meanwhile, the US Dollar Index (DXY) has dropped after facing stiff barricades around 104.30.
USD/CAD is hovering near the neckline of the Head and Shoulder chart pattern formed on an hourly scale, which is plotted around 1.3584. A slippage below the neckline support would result in a sheer breakdown. The 20-period Exponential Moving Average (EMA) at 1.3596 is acting as a barricade for the US Dollar bulls.
Meanwhile, the Relative Strength Index (RSI) (14) is oscillating in the 40.00-60.00 range. A downside momentum will get triggered after a breakdown below 40.00.
Going forward, a break below May 29 low at 1.3584 will drag the asset toward May 23 high at 1.3550. A breakdown below the latter will expose the Loonie asset to psychological support at 1.3500.
On the contrary, a fresh buy would come above May 26 high at 1.3655, which would drive the asset toward the round-level resistance at 1.3700 followed by March 27 high at 1.3745.
Technical Levels: Supports and Resistances
USDCAD currently trading at 1.359 at the time of writing. Pair opened at 1.3617 and is trading with a change of -0.2 % .
| Overview | Overview.1 | |
|---|---|---|
| 0 | Today last price | 1.3590 |
| 1 | Today Daily Change | -0.0027 |
| 2 | Today Daily Change % | -0.2000 |
| 3 | Today daily open | 1.3617 |
The pair remains strongly bullish on the daily timeframe. It trades above its 20 SMA @ 1.3507, 50 SMA 1.3525, 100 SMA @ 1.3511 and 200 SMA @ 1.3493.
| Trends | Trends.1 | |
|---|---|---|
| 0 | Daily SMA20 | 1.3507 |
| 1 | Daily SMA50 | 1.3525 |
| 2 | Daily SMA100 | 1.3511 |
| 3 | Daily SMA200 | 1.3493 |
The previous day high was 1.3655 while the previous day low was 1.3601. The daily 38.2% Fib levels comes at 1.3622, expected to provide resistance. Similarly, the daily 61.8% fib level is at 1.3634, expected to provide resistance.
Note the levels of interest below:
- Pivot support is noted at 1.3594, 1.357, 1.354
- Pivot resistance is noted at 1.3648, 1.3678, 1.3702
| Levels | Levels.1 |
|---|---|
| Previous Daily High | 1.3655 |
| Previous Daily Low | 1.3601 |
| Previous Weekly High | 1.3655 |
| Previous Weekly Low | 1.3485 |
| Previous Monthly High | 1.3668 |
| Previous Monthly Low | 1.3301 |
| Daily Fibonacci 38.2% | 1.3622 |
| Daily Fibonacci 61.8% | 1.3634 |
| Daily Pivot Point S1 | 1.3594 |
| Daily Pivot Point S2 | 1.3570 |
| Daily Pivot Point S3 | 1.3540 |
| Daily Pivot Point R1 | 1.3648 |
| Daily Pivot Point R2 | 1.3678 |
| Daily Pivot Point R3 | 1.3702 |
[/s2If]
Nehcap Expert Advisor
The NEHCAP MT4 EA is high quality professional trading system geared to generate returns without using GRID or martingales. Each trade has strict risk per trade parameter. The pairs under management include EURUSD, GBPUSD, AUDCAD, AUDNZD,GBPAUD, EURAUD, EURCAD, CHFJPY and many more.
The system is trading live: LIVE ACCOUNT TRACKING
You can run it free. Apply for a free trial and track our account. Buy the system or use profit share mechanism to generate returns on your MT4.
Join Our Telegram Group
")


