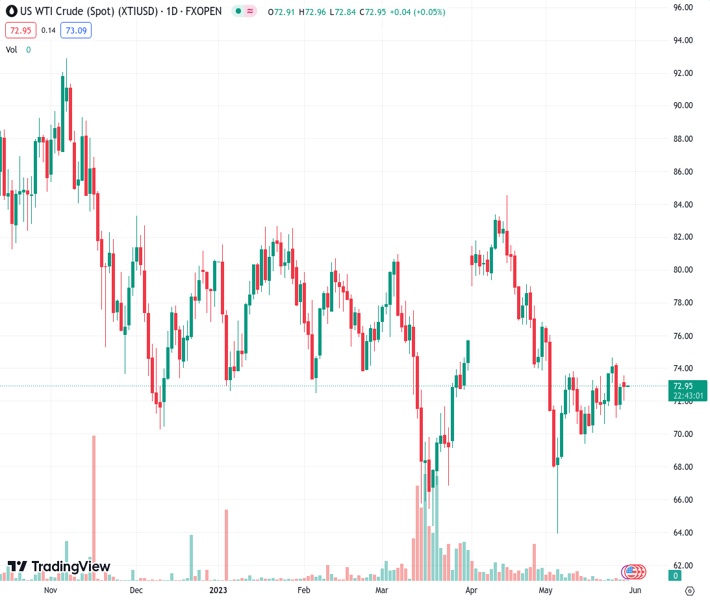
US crude oil benchmark WTI retreats from a daily high of $73.51, faltering under the $73.00 mark, impacted by looming Fed interest rate hikes threatening economic growth. (Pivot Orderbook analysis)
…
This is a premium post.
[s2If !current_user_can(access_s2member_level4)]Please register for FREE REGISTER to read full post below containing analysis. In case of any error or you think you are not able to read the full post below, please email us at support#nehcap.com [lwa][/s2If] [s2If current_user_can(access_s2member_level1)]
- US crude oil benchmark WTI retreats from a daily high of $73.51, faltering under the $73.00 mark, impacted by looming Fed interest rate hikes threatening economic growth.
- A surge in expectations for a hawkish Fed following upbeat US economic data, coupled with diminished recession likelihood, sees a 50% chance of a 25 bps rate hike, a significant increase from last month’s 8.3% odds.
- WTI’s dip eased by OPEC+ output cut hints, Saudi short-seller warnings, and Russia’s production stance; focus shifts to June 4 OPEC+ meeting.
The pair currently trades last at 72.96.
The previous day high was 73.07 while the previous day low was 71.52. The daily 38.2% Fib levels comes at 72.48, expected to provide support. Similarly, the daily 61.8% fib level is at 72.11, expected to provide support.
Western Texas Intermediate (WTI), the US crude oil benchmark, retreats after hitting a daily high of $73.51, tumbles below the $73.00 figure late in the New York session. At the time of writing, WTI is trading at $72.99, weighed by further interest rate hikes of the Federal Reserve, which could dent the prospects for economic growth.
After a solid tranche of US economic data from mid-May, investors began to price in a more hawkish Fed than initially expected. Upbeat Retail Sales, Industrial Production, GDP figures, and employment data eased the likelihood of a recession in the US. That’s reflected in the CME Fedwatch Tools, with a 50% chance of the Fed lifting rates 25 bps, up from 8.3% odds one month ago.
In the meantime, a risk-on impulse failed to underpin the WTI price, as news that the White House (WH) and the US Congress erupted that the US President Joe Biden and House Speaker Kevin McCarthy struck an agreement to raise the debt-ceiling so the country could fulfill its debt payments.
WTI’s fall was capped by last week’s comments from the Saudi Energy Minister Abdulaziz bin Salman warning short-sellers that betting on falling oil prices to “watch out,” in a possible signal that OPEC+ may further cut output. Furthermore, comments from Russian oil officials, including Deputy Prime Minister Alexander Novak, suggested that Russia is inclined to keep its current production without making changes.
The Organization of the Petroleum Exporting Countries (OPEC) and its allies, including Russia, known as OPEC+, will meet on June 4.
Technical Levels: Supports and Resistances
XTIUSD currently trading at 72.96 at the time of writing. Pair opened at 72.92 and is trading with a change of 0.05 % .
| Overview | Overview.1 | |
|---|---|---|
| 0 | Today last price | 72.96 |
| 1 | Today Daily Change | 0.04 |
| 2 | Today Daily Change % | 0.05 |
| 3 | Today daily open | 72.92 |
The pair is trading above its 20 Daily moving average @ 71.94, below its 50 Daily moving average @ 74.6 , below its 100 Daily moving average @ 75.99 and below its 200 Daily moving average @ 79.62
| Trends | Trends.1 | |
|---|---|---|
| 0 | Daily SMA20 | 71.94 |
| 1 | Daily SMA50 | 74.60 |
| 2 | Daily SMA100 | 75.99 |
| 3 | Daily SMA200 | 79.62 |
The previous day high was 73.07 while the previous day low was 71.52. The daily 38.2% Fib levels comes at 72.48, expected to provide support. Similarly, the daily 61.8% fib level is at 72.11, expected to provide support.
Note the levels of interest below:
- Pivot support is noted at 71.94, 70.96, 70.39
- Pivot resistance is noted at 73.49, 74.05, 75.03
| Levels | Levels.1 |
|---|---|
| Previous Daily High | 73.07 |
| Previous Daily Low | 71.52 |
| Previous Weekly High | 74.70 |
| Previous Weekly Low | 70.66 |
| Previous Monthly High | 83.40 |
| Previous Monthly Low | 73.88 |
| Daily Fibonacci 38.2% | 72.48 |
| Daily Fibonacci 61.8% | 72.11 |
| Daily Pivot Point S1 | 71.94 |
| Daily Pivot Point S2 | 70.96 |
| Daily Pivot Point S3 | 70.39 |
| Daily Pivot Point R1 | 73.49 |
| Daily Pivot Point R2 | 74.05 |
| Daily Pivot Point R3 | 75.03 |
[/s2If]
Nehcap Expert Advisor
The NEHCAP MT4 EA is high quality professional trading system geared to generate returns without using GRID or martingales. Each trade has strict risk per trade parameter. The pairs under management include EURUSD, GBPUSD, AUDCAD, AUDNZD,GBPAUD, EURAUD, EURCAD, CHFJPY and many more.
The system is trading live: LIVE ACCOUNT TRACKING
You can run it free. Apply for a free trial and track our account. Buy the system or use profit share mechanism to generate returns on your MT4.
Join Our Telegram Group
")


