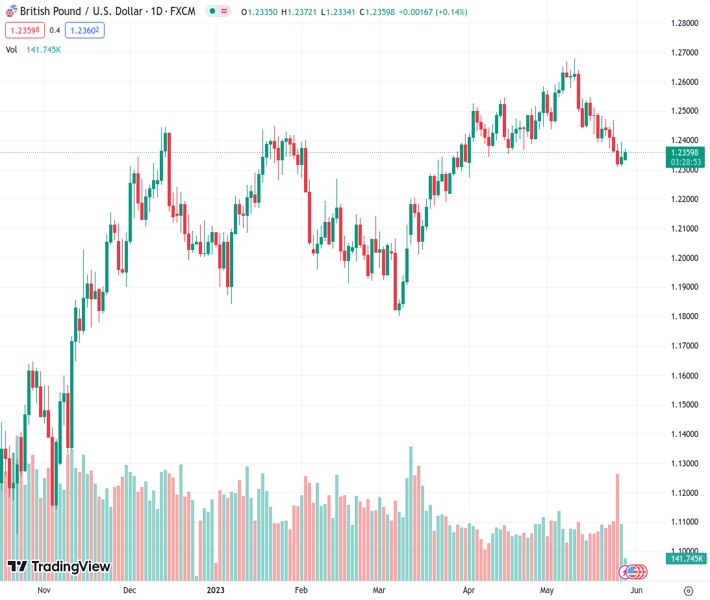
#GBPUSD @ 1.23597 The Cable trades with gains for a second consecutive day. (Pivot Orderbook analysis)
…
This is a premium post.
[s2If !current_user_can(access_s2member_level4)]Please register for FREE REGISTER to read full post below containing analysis. In case of any error or you think you are not able to read the full post below, please email us at support#nehcap.com [lwa][/s2If] [s2If current_user_can(access_s2member_level1)]
- The Cable trades with gains for a second consecutive day.
- The US debt-ceiling agreement favored a positive market environment
- Focus shifts to NFP data from May from the US.
The pair currently trades last at 1.23597.
The previous day high was 1.2395 while the previous day low was 1.2311. The daily 38.2% Fib levels comes at 1.2363, expected to provide resistance. Similarly, the daily 61.8% fib level is at 1.2343, expected to provide support.
Cable trades with gains near the 1.2350 area and benefits from the positive market mood fueled by the announcement on Sunday regarding an agreement on the debt ceiling between US President Joe Biden and Republican House Speaker Kevin McCarthy. While neither country will release relevant economic reports the pace of the session will be dictated by the market assessment of the mentioned agreement.
On Sunday, Joe Biden and Kevin McCarthy made a joint announcement, stating that they have reached an agreement regarding the extension of the debt ceiling. According to the proposed deal, the government would be allowed to borrow money without increasing the limit, which would be temporarily suspended until 2025. However, the proposal still requires approval from Congress, although US officials are hopeful that it will be passed.
The news of the agreement was well-received by Wall Street futures, leading to a rise in their value and exerting downward pressure on the US Dollar.
For the rest of the week, the focus will shift to Nonfarm Payrolls (NFP) data from the US from May which is expected to hint at more pain in the American labor market. In that sense the outlook may have an impact on expectations from the next Federal Reserve (Fed) meeting in June and hence on the US Dollar price dynamics.
Technically speaking, the GBP/USD holds a neutral to bearish outlook for the short term. The bears are struggling to maintain their dominance, but technical indicators are still unfavorable, suggesting that the market may still have some downside potential.
The psychological mark at 1.2320 is the immediate support level for GBP/USD. A break below this level could pave the way towards the 100-day Simple Moving Average (SMA) at 1.2290 area and then to the 1.2250 zone. Furthermore, a move above the 1.2390 level would favor the bull’s momentum with next resistances at the 1.2450 zone and 20-day SMA at 1.2480.
Technical Levels: Supports and Resistances
GBPUSD currently trading at 1.2361 at the time of writing. Pair opened at 1.2348 and is trading with a change of 0.11 % .
| Overview | Overview.1 | |
|---|---|---|
| 0 | Today last price | 1.2361 |
| 1 | Today Daily Change | 0.0013 |
| 2 | Today Daily Change % | 0.1100 |
| 3 | Today daily open | 1.2348 |
The pair is trading below its 20 Daily moving average @ 1.249, below its 50 Daily moving average @ 1.2435 , above its 100 Daily moving average @ 1.2288 and above its 200 Daily moving average @ 1.1978
| Trends | Trends.1 | |
|---|---|---|
| 0 | Daily SMA20 | 1.2490 |
| 1 | Daily SMA50 | 1.2435 |
| 2 | Daily SMA100 | 1.2288 |
| 3 | Daily SMA200 | 1.1978 |
The previous day high was 1.2395 while the previous day low was 1.2311. The daily 38.2% Fib levels comes at 1.2363, expected to provide resistance. Similarly, the daily 61.8% fib level is at 1.2343, expected to provide support.
Note the levels of interest below:
- Pivot support is noted at 1.2307, 1.2267, 1.2223
- Pivot resistance is noted at 1.2391, 1.2435, 1.2476
| Levels | Levels.1 |
|---|---|
| Previous Daily High | 1.2395 |
| Previous Daily Low | 1.2311 |
| Previous Weekly High | 1.2472 |
| Previous Weekly Low | 1.2308 |
| Previous Monthly High | 1.2584 |
| Previous Monthly Low | 1.2275 |
| Daily Fibonacci 38.2% | 1.2363 |
| Daily Fibonacci 61.8% | 1.2343 |
| Daily Pivot Point S1 | 1.2307 |
| Daily Pivot Point S2 | 1.2267 |
| Daily Pivot Point S3 | 1.2223 |
| Daily Pivot Point R1 | 1.2391 |
| Daily Pivot Point R2 | 1.2435 |
| Daily Pivot Point R3 | 1.2476 |
[/s2If]
Nehcap Expert Advisor
The NEHCAP MT4 EA is high quality professional trading system geared to generate returns without using GRID or martingales. Each trade has strict risk per trade parameter. The pairs under management include EURUSD, GBPUSD, AUDCAD, AUDNZD,GBPAUD, EURAUD, EURCAD, CHFJPY and many more.
The system is trading live: LIVE ACCOUNT TRACKING
You can run it free. Apply for a free trial and track our account. Buy the system or use profit share mechanism to generate returns on your MT4.
Join Our Telegram Group
")


