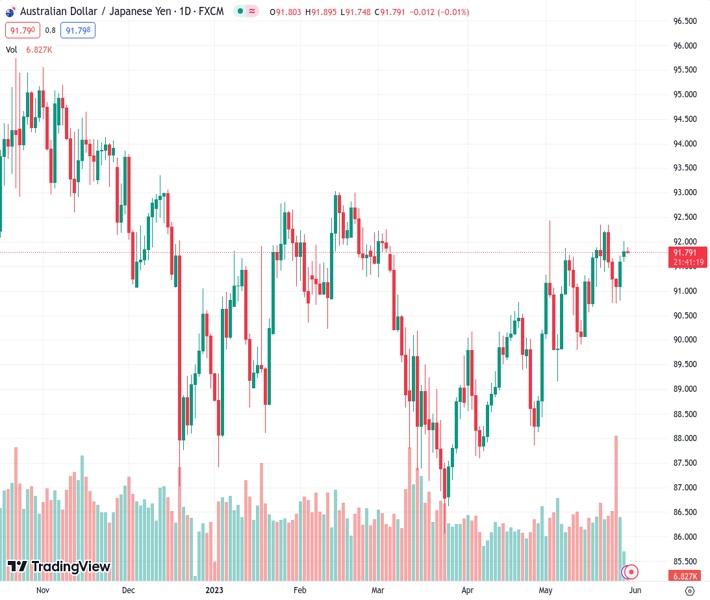
#AUDJPY @ 91.8020 kicks off the week just under the 92.00 mark, leveraging positive market sentiment that favors riskier assets over safe havens like the Japanese Yen. (Pivot Orderbook analysis)
…
This is a premium post.
[s2If !current_user_can(access_s2member_level4)]Please register for FREE REGISTER to read full post below containing analysis. In case of any error or you think you are not able to read the full post below, please email us at support#nehcap.com [lwa][/s2If] [s2If current_user_can(access_s2member_level1)]
- AUD/JPY kicks off the week just under the 92.00 mark, leveraging positive market sentiment that favors riskier assets over safe havens like the Japanese Yen.
- The AUD/JPY technical outlook remains bullish, with indicators like the RSI and the 3-day RoC hinting at gathering momentum among buyers.
- AUD/JPY faces immediate resistance at 92.00, with the potential to challenge the YTD high of 92.99; downside support stands at the May 29 low of 91.59, with further falls potentially targeting 91.00.
The pair currently trades last at 91.8020.
The previous day high was 91.72 while the previous day low was 90.8. The daily 38.2% Fib levels comes at 91.37, expected to provide support. Similarly, the daily 61.8% fib level is at 91.15, expected to provide support.
AUD/JPY begins the week on the right foot, though almost unchanged as Tuesday’s Asian session begins, registering minuscule gains of 0.05%, below the 92.00 figure. An upbeat market sentiment could bolster appetite for riskier assets, leaving safe-haven assets or peers like the Japanese Yen (JPY) vulnerable to further losses.
From a technical perspective, the AUD/JPY is upward biased. Given the fundamental backdrop with an improvement in risk appetite, further upside is expected. But on its way north, the AUD/JPY must hurdle some crucial resistance levels. Additionally, the Relative Strength Index (RSI) indicator is in bullish territory, while the 3-day Rate of Change (RoC) jumped above its prior day peak, suggesting that buyers are gathering momentum.
The AUD/JPY first resistance would be the 92.00 mark. Break above will expose the last week’s high of 92.35, followed by the 92.50 mid-point before challenging the year-to-date (YTD) high of 92.99. On the other hand, the AUD/JPY first support would be the 91.59 May 29 low. Once cleared, the AUD/JPy could dive toward one-month-old upslope support at around 91.30/91.20 before dropping toward 91.00.
Technical Levels: Supports and Resistances
AUDJPY currently trading at 91.89 at the time of writing. Pair opened at 91.63 and is trading with a change of 0.28 % .
| Overview | Overview.1 | |
|---|---|---|
| 0 | Today last price | 91.89 |
| 1 | Today Daily Change | 0.26 |
| 2 | Today Daily Change % | 0.28 |
| 3 | Today daily open | 91.63 |
The pair is trading above its 20 Daily moving average @ 91.12, above its 50 Daily moving average @ 89.79 , above its 100 Daily moving average @ 90.41 and below its 200 Daily moving average @ 91.92
| Trends | Trends.1 | |
|---|---|---|
| 0 | Daily SMA20 | 91.12 |
| 1 | Daily SMA50 | 89.79 |
| 2 | Daily SMA100 | 90.41 |
| 3 | Daily SMA200 | 91.92 |
The previous day high was 91.72 while the previous day low was 90.8. The daily 38.2% Fib levels comes at 91.37, expected to provide support. Similarly, the daily 61.8% fib level is at 91.15, expected to provide support.
Note the levels of interest below:
- Pivot support is noted at 91.04, 90.46, 90.12
- Pivot resistance is noted at 91.97, 92.3, 92.89
| Levels | Levels.1 |
|---|---|
| Previous Daily High | 91.72 |
| Previous Daily Low | 90.80 |
| Previous Weekly High | 92.35 |
| Previous Weekly Low | 90.76 |
| Previous Monthly High | 90.78 |
| Previous Monthly Low | 87.59 |
| Daily Fibonacci 38.2% | 91.37 |
| Daily Fibonacci 61.8% | 91.15 |
| Daily Pivot Point S1 | 91.04 |
| Daily Pivot Point S2 | 90.46 |
| Daily Pivot Point S3 | 90.12 |
| Daily Pivot Point R1 | 91.97 |
| Daily Pivot Point R2 | 92.30 |
| Daily Pivot Point R3 | 92.89 |
[/s2If]
Nehcap Expert Advisor
The NEHCAP MT4 EA is high quality professional trading system geared to generate returns without using GRID or martingales. Each trade has strict risk per trade parameter. The pairs under management include EURUSD, GBPUSD, AUDCAD, AUDNZD,GBPAUD, EURAUD, EURCAD, CHFJPY and many more.
The system is trading live: LIVE ACCOUNT TRACKING
You can run it free. Apply for a free trial and track our account. Buy the system or use profit share mechanism to generate returns on your MT4.
Join Our Telegram Group
")


