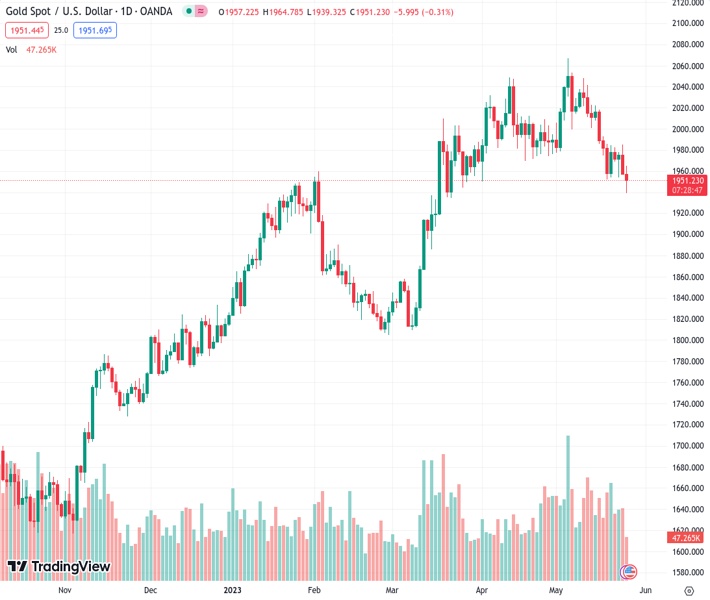
#XAUUSD @ 1,950.82 Gold price came under renewed bearish pressure on Thursday. (Pivot Orderbook analysis)
…
This is a premium post.
[s2If !current_user_can(access_s2member_level4)]Please register for FREE REGISTER to read full post below containing analysis. In case of any error or you think you are not able to read the full post below, please email us at support#nehcap.com [lwa][/s2If] [s2If current_user_can(access_s2member_level1)]
- Gold price came under renewed bearish pressure on Thursday.
- First-quarter US GDP growth revised higher to 1.3%.
- 10-year US Treasury bond yield is up more than 1% near 3.8%.
The pair currently trades last at 1950.82.
The previous day high was 1985.3 while the previous day low was 1956.79. The daily 38.2% Fib levels comes at 1967.68, expected to provide resistance. Similarly, the daily 61.8% fib level is at 1974.41, expected to provide resistance.
Gold price turned south and dropped to its weakest level since late March slightly below $1,945 on Thursday before staging a modest rebound. As of writing, XAU/USD was down 0.55% on the day at $1,945.
The US Bureau of Economic Analysis announced that it revised the annualized Gross Domestic Product (GDP) growth for the first quarter to 1.3% from the advance estimate of 1.1%. Additionally, the US Department of Labor’s weekly report revealed that there were 229,000 initial claims for unemployment benefits in the week ending May 20, much lower than the market expectation of 245,000.
Boosted by the upbeat macroeconomic data releases, the benchmark 10-year US Treasury bond yield gained nearly 1% and reached 3.8% for the first time since the second week of March, weighing on the inversely-correlated XAU/USD.
According to the CME Group FedWatch Tool, markets are currently pricing in a less than 60% probability of the US Federal Reserve leaving its policy rate unchanged in June, compared to nearly 80% earlier this week.
Later in the session, April Pending Home Sales and Kansas Fed Manufacturing Activity data for May will be featured in the US economic docket. Investors will continue to pay close attention to fresh developments surrounding the debt-limit negotiations as well.
Technical Levels: Supports and Resistances
XAUUSD currently trading at 1943.69 at the time of writing. Pair opened at 1957.11 and is trading with a change of -0.69 % .
| Overview | Overview.1 | |
|---|---|---|
| 0 | Today last price | 1943.69 |
| 1 | Today Daily Change | -13.42 |
| 2 | Today Daily Change % | -0.69 |
| 3 | Today daily open | 1957.11 |
The pair is trading below its 20 Daily moving average @ 2001.08, below its 50 Daily moving average @ 1992.02 , above its 100 Daily moving average @ 1933.1 and above its 200 Daily moving average @ 1828.59
| Trends | Trends.1 | |
|---|---|---|
| 0 | Daily SMA20 | 2001.08 |
| 1 | Daily SMA50 | 1992.02 |
| 2 | Daily SMA100 | 1933.10 |
| 3 | Daily SMA200 | 1828.59 |
The previous day high was 1985.3 while the previous day low was 1956.79. The daily 38.2% Fib levels comes at 1967.68, expected to provide resistance. Similarly, the daily 61.8% fib level is at 1974.41, expected to provide resistance.
Note the levels of interest below:
- Pivot support is noted at 1947.5, 1937.89, 1918.99
- Pivot resistance is noted at 1976.01, 1994.91, 2004.52
| Levels | Levels.1 |
|---|---|
| Previous Daily High | 1985.30 |
| Previous Daily Low | 1956.79 |
| Previous Weekly High | 2022.18 |
| Previous Weekly Low | 1952.01 |
| Previous Monthly High | 2048.75 |
| Previous Monthly Low | 1949.83 |
| Daily Fibonacci 38.2% | 1967.68 |
| Daily Fibonacci 61.8% | 1974.41 |
| Daily Pivot Point S1 | 1947.50 |
| Daily Pivot Point S2 | 1937.89 |
| Daily Pivot Point S3 | 1918.99 |
| Daily Pivot Point R1 | 1976.01 |
| Daily Pivot Point R2 | 1994.91 |
| Daily Pivot Point R3 | 2004.52 |
[/s2If]
Nehcap Expert Advisor
The NEHCAP MT4 EA is high quality professional trading system geared to generate returns without using GRID or martingales. Each trade has strict risk per trade parameter. The pairs under management include EURUSD, GBPUSD, AUDCAD, AUDNZD,GBPAUD, EURAUD, EURCAD, CHFJPY and many more.
The system is trading live: LIVE ACCOUNT TRACKING
You can run it free. Apply for a free trial and track our account. Buy the system or use profit share mechanism to generate returns on your MT4.
Join Our Telegram Group
")


