#USDJPY @ 139.606 retreats from YTD top near 139.70 as BoJ’s Ueda praises Japan’s economic transition (Pivot Orderbook analysis)
…
This is a premium post.
[s2If !current_user_can(access_s2member_level4)]Please register for FREE REGISTER to read full post below containing analysis. In case of any error or you think you are not able to read the full post below, please email us at support#nehcap.com [lwa][/s2If] [s2If current_user_can(access_s2member_level1)]
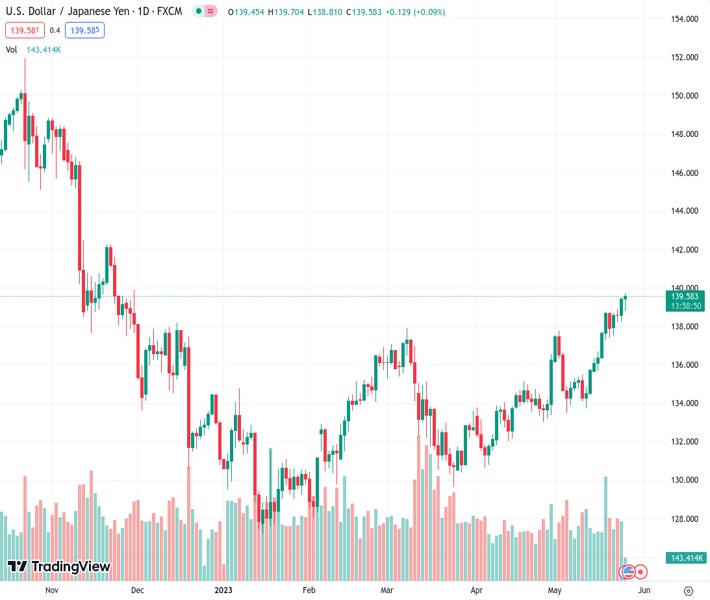
The pair currently trades last at 139.606.
The previous day high was 139.48 while the previous day low was 138.23. The daily 38.2% Fib levels comes at 139.0, expected to provide support. Similarly, the daily 61.8% fib level is at 138.71, expected to provide support.
USD/JPY bulls take a breather after refreshing the Year-To-Date (YTD) high, declining to 139.50 amid early hours of Thursday’s European session. In doing so, the Yen pair reveres the intraday gains but remains dismal amid mixed markets.
That said, Bank of Japan (BoJ) Governor Kazuo Ueda recently crossed wires, via Reuters, as he said that they are beginning to see good signs in the economy but still some distance to stably, sustainably hitting the inflation target. The policymaker also stated, “BoJ will patiently sustain the easy monetary policy.”
On the other hand, US Treasury bond yields remain firmer at the highest levels since mid-March and put a floor under the USD/JPY prices. Recently, a downward revision in Germany’s Q1 GDP renews recession fears in the European powerhouse and hence allowed the US Dollar to remain firmer, as well as back the bond coupons at the multi-day high.
While BoJ’s Ueda defends easy money policy, the Minutes of the latest Federal Open Market Committee (FOMC) Meeting, the policymakers are divided about the latest 0.25% rate hike from the US central bank. The same doubts the market’s bets on another such move in June even if Atlanta Fed President Raphael Bostic and Federal Reserve Governor Christopher Waller prod the hawkish Fed concerns.
Above all, the US policymakers’ inability to deliver a debt ceiling extension deal and the looming long weekend for the House Representatives contrasts with the negotiators’ view that they see progress in the latest rounds of talks. Even so, global rating agencies like Fitch and Moody’s turned cautious about the US credit rating status while the US Treasury Department accepted their fears. With this, the market’s rush towards risk safety gains momentum and propels the US Dollar, as well as the yields.
Amid these plays, the US stock futures lick its wounds while the US Treasury bond yields remain firmer at the highest levels since mid-March.
While the USD/JPY buyers take a breather, they’re not off the table amid fears surrounding the US default and divergence between the Fed and BoJ policies. Apart from these catalysts, the US weekly Jobless Claims, the Chicago Fed National Activity Index and Pending Home Sales should also be eyed for clear directions.
USD/JPY prods the 50% Fibonacci retracement level of its October 2022 to January 2023 downside amid overbought conditions of the RSI (14) line. Apart from the 50% Fibonacci retracement level surrounding 139.60, the late November 2022 peak of around 139.90, quickly followed by the 140.00 round figure, also challenge the Yen pair sellers.
Meanwhile, the previous resistance line stretched from December 2022, close to 137.80 at the latest, restricts the immediate downside of the USD/JPY pair.
Technical Levels: Supports and Resistances
USDJPY currently trading at 139.49 at the time of writing. Pair opened at 139.46 and is trading with a change of 0.02% % .
| Overview | Overview.1 | |
|---|---|---|
| 0 | Today last price | 139.49 |
| 1 | Today Daily Change | 0.03 |
| 2 | Today Daily Change % | 0.02% |
| 3 | Today daily open | 139.46 |
The pair remains strongly bullish on the daily timeframe. It trades above its 20 SMA @ 136.32, 50 SMA 134.18, 100 SMA @ 133.36 and 200 SMA @ 137.19.
| Trends | Trends.1 | |
|---|---|---|
| 0 | Daily SMA20 | 136.32 |
| 1 | Daily SMA50 | 134.18 |
| 2 | Daily SMA100 | 133.36 |
| 3 | Daily SMA200 | 137.19 |
The previous day high was 139.48 while the previous day low was 138.23. The daily 38.2% Fib levels comes at 139.0, expected to provide support. Similarly, the daily 61.8% fib level is at 138.71, expected to provide support.
Note the levels of interest below:
- Pivot support is noted at 138.64, 137.81, 137.39
- Pivot resistance is noted at 139.88, 140.3, 141.13
| Levels | Levels.1 |
|---|---|
| Previous Daily High | 139.48 |
| Previous Daily Low | 138.23 |
| Previous Weekly High | 138.75 |
| Previous Weekly Low | 135.65 |
| Previous Monthly High | 136.56 |
| Previous Monthly Low | 130.63 |
| Daily Fibonacci 38.2% | 139.00 |
| Daily Fibonacci 61.8% | 138.71 |
| Daily Pivot Point S1 | 138.64 |
| Daily Pivot Point S2 | 137.81 |
| Daily Pivot Point S3 | 137.39 |
| Daily Pivot Point R1 | 139.88 |
| Daily Pivot Point R2 | 140.30 |
| Daily Pivot Point R3 | 141.13 |
[/s2If]
Nehcap Expert Advisor
The NEHCAP MT4 EA is high quality professional trading system geared to generate returns without using GRID or martingales. Each trade has strict risk per trade parameter. The pairs under management include EURUSD, GBPUSD, AUDCAD, AUDNZD,GBPAUD, EURAUD, EURCAD, CHFJPY and many more.
The system is trading live: LIVE ACCOUNT TRACKING
You can run it free. Apply for a free trial and track our account. Buy the system or use profit share mechanism to generate returns on your MT4.
Join Our Telegram Group
")


