#USDINR @ 82.7460 Price Analysis: Indian Rupee slides back below 82.60 key technical hurdle, @nehcap view: Further upside expected (Pivot Orderbook analysis)
…
This is a premium post.
[s2If !current_user_can(access_s2member_level4)]Please register for FREE REGISTER to read full post below containing analysis. In case of any error or you think you are not able to read the full post below, please email us at support#nehcap.com [lwa][/s2If] [s2If current_user_can(access_s2member_level1)]
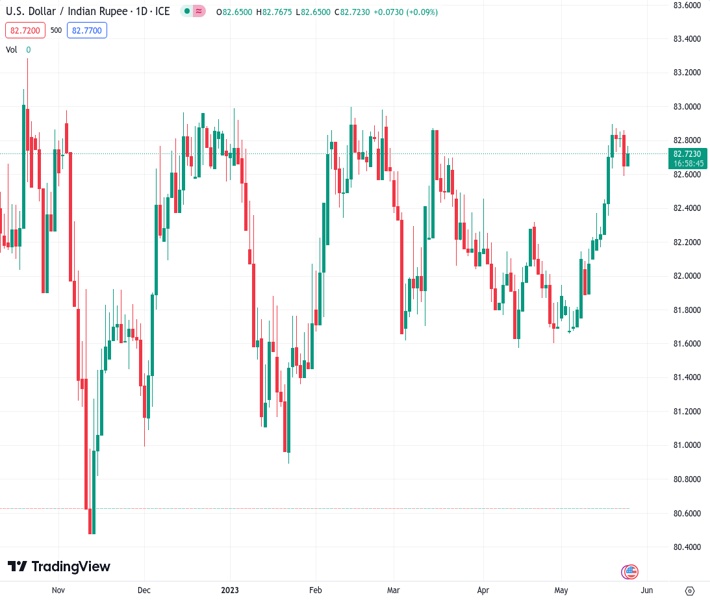
The pair currently trades last at 82.7460.
The previous day high was 82.981 while the previous day low was 82.573. The daily 38.2% Fib levels comes at 82.7289, expected to provide support. Similarly, the daily 61.8% fib level is at 82.8252, expected to provide resistance.
USD/INR renews its intraday high near 82.75 as it extends late Wednesday’s rebound from a short-term key support confluence to early Thursday in Europe. In doing so, the Indian Rupee (INR) consolidates the biggest daily loss in a month.
50-SMA and an upward-sloping trend line from May 08 together restrict short-term USD/INR downside near 82.60.
The recovery moves, however, appear elusive unless crossing the 21-SMA hurdle of around 82.75.
It’s worth noting that the bearish MACD signals challenge the USD/INR pair buyers as the key jostle with the 21-SMA resistance, a break of which could propel prices towards a one-week-old horizontal resistance zone surrounding 82.95-97.
Following that, the 83.00 rounds figure can act as the last defense of the USD/INR pair bears before pushing the quote towards the record high of around 83.40 marked the last year.
On the flip side, the USD/INR pair’s break of the 82.60 support confluence could quickly drag it toward the 100-SMA level of near 82.25. Though, a horizontal area comprising multiple lows marked since May 09, near 82.15 can challenge the Indian Rupee pair’s further downside.
Overall, USD/INR remains on the bull’s radar but the upside past 83.00 appears doubtful.
Trend: Further upside expected
Technical Levels: Supports and Resistances
USDINR currently trading at 82.7455 at the time of writing. Pair opened at 82.681 and is trading with a change of 0.08% % .
| Overview | Overview.1 | |
|---|---|---|
| 0 | Today last price | 82.7455 |
| 1 | Today Daily Change | 0.0645 |
| 2 | Today Daily Change % | 0.08% |
| 3 | Today daily open | 82.681 |
The pair remains strongly bullish on the daily timeframe. It trades above its 20 SMA @ 82.1738, 50 SMA 82.1504, 100 SMA @ 82.1423 and 200 SMA @ 81.8285.
| Trends | Trends.1 | |
|---|---|---|
| 0 | Daily SMA20 | 82.1738 |
| 1 | Daily SMA50 | 82.1504 |
| 2 | Daily SMA100 | 82.1423 |
| 3 | Daily SMA200 | 81.8285 |
The previous day high was 82.981 while the previous day low was 82.573. The daily 38.2% Fib levels comes at 82.7289, expected to provide support. Similarly, the daily 61.8% fib level is at 82.8252, expected to provide resistance.
Note the levels of interest below:
- Pivot support is noted at 82.5091, 82.337, 82.1011
- Pivot resistance is noted at 82.9171, 83.1531, 83.3251
| Levels | Levels.1 |
|---|---|
| Previous Daily High | 82.9810 |
| Previous Daily Low | 82.5730 |
| Previous Weekly High | 82.9554 |
| Previous Weekly Low | 82.1655 |
| Previous Monthly High | 82.5092 |
| Previous Monthly Low | 81.4850 |
| Daily Fibonacci 38.2% | 82.7289 |
| Daily Fibonacci 61.8% | 82.8252 |
| Daily Pivot Point S1 | 82.5091 |
| Daily Pivot Point S2 | 82.3370 |
| Daily Pivot Point S3 | 82.1011 |
| Daily Pivot Point R1 | 82.9171 |
| Daily Pivot Point R2 | 83.1531 |
| Daily Pivot Point R3 | 83.3251 |
[/s2If]
Nehcap Expert Advisor
The NEHCAP MT4 EA is high quality professional trading system geared to generate returns without using GRID or martingales. Each trade has strict risk per trade parameter. The pairs under management include EURUSD, GBPUSD, AUDCAD, AUDNZD,GBPAUD, EURAUD, EURCAD, CHFJPY and many more.
The system is trading live: LIVE ACCOUNT TRACKING
You can run it free. Apply for a free trial and track our account. Buy the system or use profit share mechanism to generate returns on your MT4.
Join Our Telegram Group
")


