#USDCAD @ 1.36377 US bond yields climb amid debt ceiling uncertainty, with the 10-year rate reaching 3.789%, a high since the Silicon Valley Bank collapse. (Pivot Orderbook analysis)
…
This is a premium post.
[s2If !current_user_can(access_s2member_level4)]Please register for FREE REGISTER to read full post below containing analysis. In case of any error or you think you are not able to read the full post below, please email us at support#nehcap.com [lwa][/s2If] [s2If current_user_can(access_s2member_level1)]
- US bond yields climb amid debt ceiling uncertainty, with the 10-year rate reaching 3.789%, a high since the Silicon Valley Bank collapse.
- US economy displays recovery signs with lower-than-expected jobless claims and an upwardly revised Q1 GDP, while the Fed hints at a pause in rate hikes.
- Canadian Manufacturing Sales declined by 0.2% in April, highlighting the economic contrast between the US and Canada.
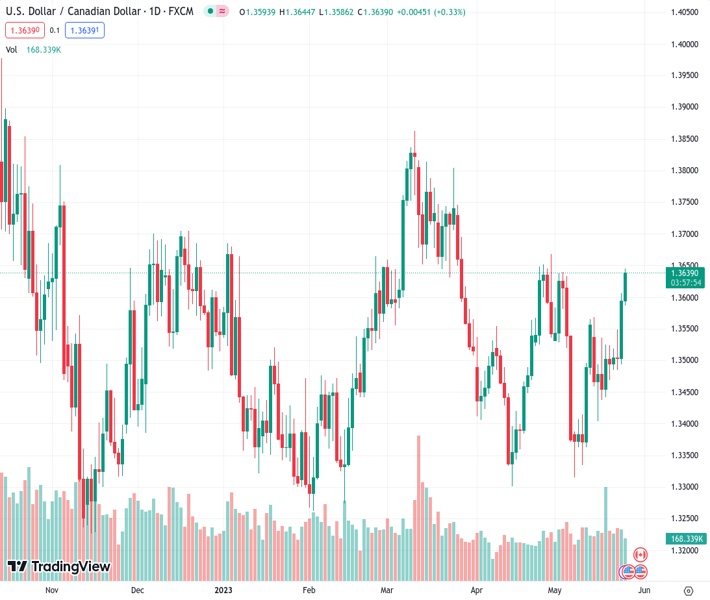
The pair currently trades last at 1.36377.
The previous day high was 1.3606 while the previous day low was 1.3496. The daily 38.2% Fib levels comes at 1.3564, expected to provide support. Similarly, the daily 61.8% fib level is at 1.3538, expected to provide support.
USD/CAD reclaims the 1.3600 figure after hitting a daily low of 1.3586, climbs for two consecutive days toward the April 28 swing high at 1.3667, on mixed market sentiment, as the Nasdaq rises. The financial markets narrative remains the same, with Republicans and Democrats unable to reach an agreement despite Fitch Ratings threatening to review the US qualification. The USD-CAD is trading at 1.3639.
US House Speaker Kevin McCarthy said that both sides made some progress but that “There are still outstanding issues. I’ve directed our team to work 24/7 to solve this problem.” Uncertainty around the negotiations keeps US Treasury bond yields climbing, with the US 10-year benchmark note rate at 3.789%, its highest level since the Silicon Valley Bank (SVB) collapse on March 10.
Meanwhile, US Treasury Secretary Janet Yellen continued her campaign putting pressure on the US Congress, stating the US would run out of cash by June 1. Some consequences of the political drama in Washington triggered a reaction by Fitch Rating, warning that the US AAA rating is under threat.
Consequently, the US Dollar Index (DXY), which measures the performance of a basket of six currencies vs. the greenback, trades at 104.266, gains 0.36%. Therefore, the USD/CAD climbs on a strong US Dollar (USD), and weaker oil prices, as WTI tmbles more than 3%.
Aside from geopolitical jittery, US economic data shows the economy regaining momentum, as the Initial Jobless Claims for the week ending on May 20 expanded by 229K below expectations of 245K, as revealed by the US Bureau of Labor Statistics (BLS). In another report, the second estimate of the US Gross Domestic Product (GDP) for Q1 was revised from 1.1% to 1.3%.
On Wednesday, the US Federal Reserve revealed the May meeting minutes, which showed that the US central bank is open to pause rates at the upcoming meetings, though emphasized that some flexibility is needed in the case of needing higher rates. Furthermore, participants commented the current monetary policy is impacting the economy as bank credit tightened, that no rate cuts are expected in 2023, and that the Fed will be data-dependent.
On the Canadian front, Manufacturing Sales plunged -0.2% in April, below March’s 0.7% increase.
Technical Levels: Supports and Resistances
USDCAD currently trading at 1.3637 at the time of writing. Pair opened at 1.3595 and is trading with a change of 0.31 % .
| Overview | Overview.1 | |
|---|---|---|
| 0 | Today last price | 1.3637 |
| 1 | Today Daily Change | 0.0042 |
| 2 | Today Daily Change % | 0.3100 |
| 3 | Today daily open | 1.3595 |
The pair remains strongly bullish on the daily timeframe. It trades above its 20 SMA @ 1.3502, 50 SMA 1.3529, 100 SMA @ 1.3509 and 200 SMA @ 1.3487.
| Trends | Trends.1 | |
|---|---|---|
| 0 | Daily SMA20 | 1.3502 |
| 1 | Daily SMA50 | 1.3529 |
| 2 | Daily SMA100 | 1.3509 |
| 3 | Daily SMA200 | 1.3487 |
The previous day high was 1.3606 while the previous day low was 1.3496. The daily 38.2% Fib levels comes at 1.3564, expected to provide support. Similarly, the daily 61.8% fib level is at 1.3538, expected to provide support.
Note the levels of interest below:
- Pivot support is noted at 1.3525, 1.3456, 1.3415
- Pivot resistance is noted at 1.3635, 1.3675, 1.3745
| Levels | Levels.1 |
|---|---|
| Previous Daily High | 1.3606 |
| Previous Daily Low | 1.3496 |
| Previous Weekly High | 1.3568 |
| Previous Weekly Low | 1.3404 |
| Previous Monthly High | 1.3668 |
| Previous Monthly Low | 1.3301 |
| Daily Fibonacci 38.2% | 1.3564 |
| Daily Fibonacci 61.8% | 1.3538 |
| Daily Pivot Point S1 | 1.3525 |
| Daily Pivot Point S2 | 1.3456 |
| Daily Pivot Point S3 | 1.3415 |
| Daily Pivot Point R1 | 1.3635 |
| Daily Pivot Point R2 | 1.3675 |
| Daily Pivot Point R3 | 1.3745 |
[/s2If]
Nehcap Expert Advisor
The NEHCAP MT4 EA is high quality professional trading system geared to generate returns without using GRID or martingales. Each trade has strict risk per trade parameter. The pairs under management include EURUSD, GBPUSD, AUDCAD, AUDNZD,GBPAUD, EURAUD, EURCAD, CHFJPY and many more.
The system is trading live: LIVE ACCOUNT TRACKING
You can run it free. Apply for a free trial and track our account. Buy the system or use profit share mechanism to generate returns on your MT4.
Join Our Telegram Group
")


