#NZDUSD @ 0.61028 Price Analysis: Kiwi bears need validation from 0.6090-85 support zone, @nehcap view: Corrective bounce expected (Pivot Orderbook analysis)
…
This is a premium post.
[s2If !current_user_can(access_s2member_level4)]Please register for FREE REGISTER to read full post below containing analysis. In case of any error or you think you are not able to read the full post below, please email us at support#nehcap.com [lwa][/s2If] [s2If current_user_can(access_s2member_level1)]
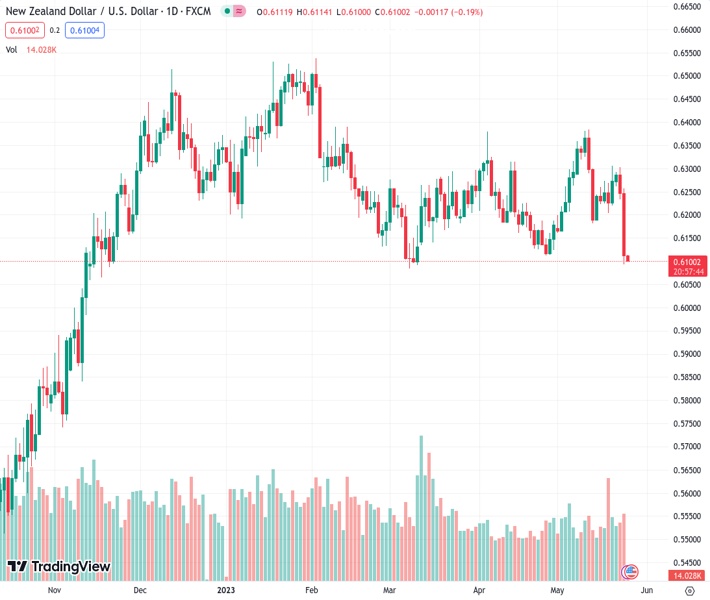
The pair currently trades last at 0.61028.
The previous day high was 0.6303 while the previous day low was 0.6233. The daily 38.2% Fib levels comes at 0.626, expected to provide resistance. Similarly, the daily 61.8% fib level is at 0.6277, expected to provide resistance.
NZD/USD bears take a breather around 0.6100 amid Thursday’s sluggish Asian session, after falling the most since early February the previous day.
The Kiwi pair’s latest inaction could be linked to the market’s mixed feelings about the Reserve Bank of New Zealand’s (RBNZ) next move as Governor Adrian Orr sounds hawkish but the central bank keeps peak rate unchanged with its 0.25% rate hike.
Also read: RBNZ’s Orr: Committee was confident in the level of restrictiveness of interest rates
Apart from RBNZ Governor Adrian Orr’s latest comments, the downbeat conditions of the RSI (14) line, also allow the NZD/USD pair to lick its wounds after a noteworthy fall the previous day.
With this, the Kiwi pair stays defensive around the key support line stretched from November 2022, around 0.6090. Also acting as a short-term downside filter is the yearly low marked in March around 0.6085.
As a result, the NZD/USD bears need to conquer the 0.6090-85 support zone to keep the reins.
Following that, the pair’s gradual fall towards the 50% and 61.8% Fibonacci retracement of October 2022 to February 2023 upside, respectively near 0.6025 and 0.5900, can be expected.
It should be noted, however, that the NZD/USD pair’s corrective bounce past the previous support line stretched from March, now immediate resistance around 0.6130, can convince short-term buyers.
In that case, a convergence of the 21-DMA and 50-DMA, near 0.6230-40, will be crucial to watch.
Trend: Corrective bounce expected
Technical Levels: Supports and Resistances
NZDUSD currently trading at 0.6105 at the time of writing. Pair opened at 0.6248 and is trading with a change of -2.29% % .
| Overview | Overview.1 | |
|---|---|---|
| 0 | Today last price | 0.6105 |
| 1 | Today Daily Change | -0.0143 |
| 2 | Today Daily Change % | -2.29% |
| 3 | Today daily open | 0.6248 |
The pair remains strongly bearish on the daily time frame. It trades below the 20 SMA @ 0.6237, 50 SMA 0.623, 100 SMA @ 0.6273 and 200 SMA @ 0.6156.
| Trends | Trends.1 | |
|---|---|---|
| 0 | Daily SMA20 | 0.6237 |
| 1 | Daily SMA50 | 0.6230 |
| 2 | Daily SMA100 | 0.6273 |
| 3 | Daily SMA200 | 0.6156 |
The previous day high was 0.6303 while the previous day low was 0.6233. The daily 38.2% Fib levels comes at 0.626, expected to provide resistance. Similarly, the daily 61.8% fib level is at 0.6277, expected to provide resistance.
Note the levels of interest below:
- Pivot support is noted at 0.622, 0.6191, 0.6149
- Pivot resistance is noted at 0.629, 0.6332, 0.636
| Levels | Levels.1 |
|---|---|
| Previous Daily High | 0.6303 |
| Previous Daily Low | 0.6233 |
| Previous Weekly High | 0.6306 |
| Previous Weekly Low | 0.6117 |
| Previous Monthly High | 0.6389 |
| Previous Monthly Low | 0.6111 |
| Daily Fibonacci 38.2% | 0.6260 |
| Daily Fibonacci 61.8% | 0.6277 |
| Daily Pivot Point S1 | 0.6220 |
| Daily Pivot Point S2 | 0.6191 |
| Daily Pivot Point S3 | 0.6149 |
| Daily Pivot Point R1 | 0.6290 |
| Daily Pivot Point R2 | 0.6332 |
| Daily Pivot Point R3 | 0.6360 |
[/s2If]
Nehcap Expert Advisor
The NEHCAP MT4 EA is high quality professional trading system geared to generate returns without using GRID or martingales. Each trade has strict risk per trade parameter. The pairs under management include EURUSD, GBPUSD, AUDCAD, AUDNZD,GBPAUD, EURAUD, EURCAD, CHFJPY and many more.
The system is trading live: LIVE ACCOUNT TRACKING
You can run it free. Apply for a free trial and track our account. Buy the system or use profit share mechanism to generate returns on your MT4.
Join Our Telegram Group
")


