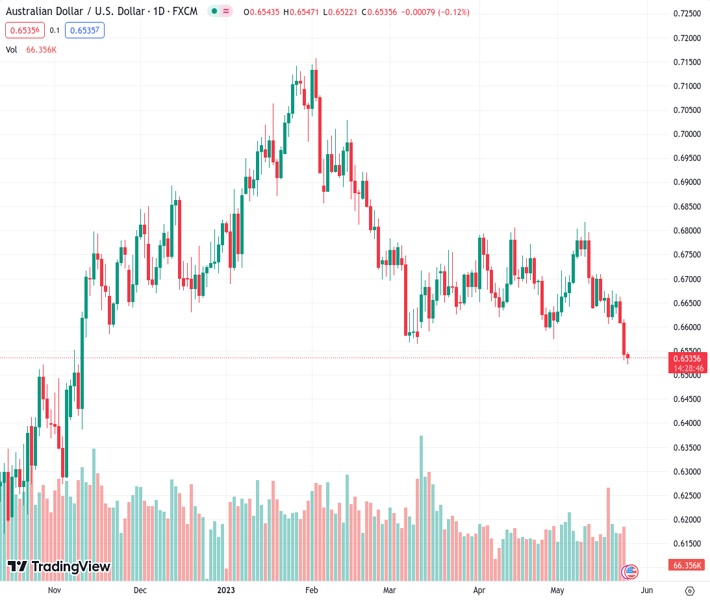
#AUDUSD @ 0.65355 bears drill multi-day bottom to approach 0.6500 as US Dollar traces firmer yields (Pivot Orderbook analysis)
…
This is a premium post.
[s2If !current_user_can(access_s2member_level4)]Please register for FREE REGISTER to read full post below containing analysis. In case of any error or you think you are not able to read the full post below, please email us at support#nehcap.com [lwa][/s2If] [s2If current_user_can(access_s2member_level1)]
The pair currently trades last at 0.65355.
The previous day high was 0.6615 while the previous day low was 0.653. The daily 38.2% Fib levels comes at 0.6562, expected to provide resistance. Similarly, the daily 61.8% fib level is at 0.6583, expected to provide resistance.
AUD/USD takes offers to renew the lowest levels in six months around 0.6520 heading into Thursday’s European session. In doing so, the Aussie pair justifies the market’s US Dollar demand amid indecision surrounding the US debt ceiling extension and the Fed concerns.
Following the Reserve Bank of New Zealand’s (RBNZ) dovish hike, the market participants expect the Reserve Bank of Australia (RBA) policymakers to follow the neighbor’s steps and amplify the RBA versus Fed divergence. The same joins this week’s FOMC Minutes and the Fed talks to weigh on the Australian Dollar (AUD).
As per the Minutes of the latest Federal Open Market Committee (FOMC) Meeting, the policymakers are divided about the latest 0.25% rate hike from the US central bank. The same doubts the market’s bets on another such move in June even if Atlanta Fed President Raphael Bostic and Federal Reserve Governor Christopher Waller prod the hawkish Fed concerns.
Elsewhere, US policymakers’ inability to deliver a debt ceiling extension deal and the looming long weekend for the House Representatives contrasts with the negotiators’ view that they see progress in the latest rounds of talks. Even so, global rating agencies like Fitch and Moody’s turned cautious about the US credit rating status while the US Treasury Department accepted their fears.
Against this backdrop, the US stock futures lick its wounds while the US Treasury bond yields remain firmer at the highest levels since mid-March.
Looking ahead, the US weekly Jobless Claims, the Chicago Fed National Activity Index and Pending Home Sales will decorate the calendar but the debt ceiling talks will be crucial to watch for clear directions.
AUD/USD pair’s sustained downside break of an 11-week-old support-turned-resistance and the 61.8% Fibonacci retracement of the quote’s October 2022 to February 2023 upside, respectively near 0.6620 and 0.6550, keeps bears hopeful. That said, the 61.8% Fibonacci Extension (FE) of its February-May moves, near 0.6445, lures the pair sellers.
Technical Levels: Supports and Resistances
AUDUSD currently trading at 0.6527 at the time of writing. Pair opened at 0.6544 and is trading with a change of -0.26% % .
| Overview | Overview.1 | |
|---|---|---|
| 0 | Today last price | 0.6527 |
| 1 | Today Daily Change | -0.0017 |
| 2 | Today Daily Change % | -0.26% |
| 3 | Today daily open | 0.6544 |
The pair remains strongly bearish on the daily time frame. It trades below the 20 SMA @ 0.6671, 50 SMA 0.6684, 100 SMA @ 0.678 and 200 SMA @ 0.6708.
| Trends | Trends.1 | |
|---|---|---|
| 0 | Daily SMA20 | 0.6671 |
| 1 | Daily SMA50 | 0.6684 |
| 2 | Daily SMA100 | 0.6780 |
| 3 | Daily SMA200 | 0.6708 |
The previous day high was 0.6615 while the previous day low was 0.653. The daily 38.2% Fib levels comes at 0.6562, expected to provide resistance. Similarly, the daily 61.8% fib level is at 0.6583, expected to provide resistance.
Note the levels of interest below:
- Pivot support is noted at 0.6511, 0.6477, 0.6425
- Pivot resistance is noted at 0.6596, 0.6649, 0.6682
| Levels | Levels.1 |
|---|---|
| Previous Daily High | 0.6615 |
| Previous Daily Low | 0.6530 |
| Previous Weekly High | 0.6710 |
| Previous Weekly Low | 0.6605 |
| Previous Monthly High | 0.6806 |
| Previous Monthly Low | 0.6574 |
| Daily Fibonacci 38.2% | 0.6562 |
| Daily Fibonacci 61.8% | 0.6583 |
| Daily Pivot Point S1 | 0.6511 |
| Daily Pivot Point S2 | 0.6477 |
| Daily Pivot Point S3 | 0.6425 |
| Daily Pivot Point R1 | 0.6596 |
| Daily Pivot Point R2 | 0.6649 |
| Daily Pivot Point R3 | 0.6682 |
[/s2If]
Nehcap Expert Advisor
The NEHCAP MT4 EA is high quality professional trading system geared to generate returns without using GRID or martingales. Each trade has strict risk per trade parameter. The pairs under management include EURUSD, GBPUSD, AUDCAD, AUDNZD,GBPAUD, EURAUD, EURCAD, CHFJPY and many more.
The system is trading live: LIVE ACCOUNT TRACKING
You can run it free. Apply for a free trial and track our account. Buy the system or use profit share mechanism to generate returns on your MT4.
Join Our Telegram Group
")


