#XAUUSD @ 1,972.28 Gold price meets with a fresh supply on Wednesday, though the downside seems cushioned. (Pivot Orderbook analysis)
…
This is a premium post.
[s2If !current_user_can(access_s2member_level4)]Please register for FREE REGISTER to read full post below containing analysis. In case of any error or you think you are not able to read the full post below, please email us at support#nehcap.com [lwa][/s2If] [s2If current_user_can(access_s2member_level1)]
- Gold price meets with a fresh supply on Wednesday, though the downside seems cushioned.
- Hawkish Federal Reserve expectations underpin the US Dollar and cap gains for the XAU/USD.
- Looming recession risks and US debt ceiling woes could lend support to the safe-haven metal.
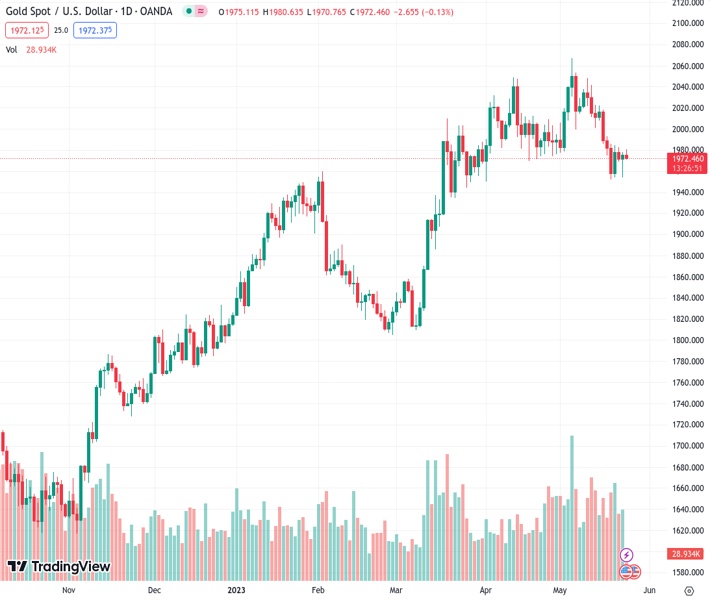
The pair currently trades last at 1972.28.
The previous day high was 1977.81 while the previous day low was 1954.28. The daily 38.2% Fib levels comes at 1968.82, expected to provide support. Similarly, the daily 61.8% fib level is at 1963.27, expected to provide support.
Gold price struggles to capitalize on its modest intraday uptick and attracts some selling near the $1,980 region during the early European session on Wednesday. The XAU/USD drops back closer to the $1,970 level in the last hour and for now, seems to have stalled the overnight bounce from the vicinity of the monthly low touched last week.
The recent hawkish remarks by several Federal Reserve (Fed) officials raised the possibility of further rate hikes, with markets now pricing in a 30% chance of another 25 basis points (bps) lift-off in June. This turns out to be a key factor acting as a headwind for the non-yielding Gold price. Hence, the market focus will remain glued to the release of the Federal Open Market Committee (FOMC) meeting minutes, due later during the US session. Investors will look for clues about the future rate-hike path, which will play a key role in influencing the near-term US Dollar (USD) price dynamics and provide a fresh directional impetus to the XAU/USD.
In the meantime, the lack of progress in talks over increasing the United States (US) debt ceiling, along with worries about a global economic slowdown, could limit the downside for the safe-haven Gold price. It is worth recalling that Representatives of President Joe Biden and congressional Republicans ended another round of debt ceiling negotiations on Tuesday without an agreement to raise the government’s $31.4 trillion borrowing limit. This raises fears of an unprecedented American debt default and weighs on investors’ sentiment. Apart from this, looming recession risks might further hold back bears from placing aggressive bets around the XAU/USD.
The market concerns resurfaced on Tuesday after the flash Eurozone PMIs showed that the overall business activity slowed slightly more than anticipated as the dominant services industry lost a little of its shine and the downturn in the manufacturing sector deepened in May. This comes on the back of dismal Chinese macro data released last week, which indicated that the world’s second-largest economy underperformed in May. This, in turn, warrants some caution before positioning for the resumption of the recent pullback from the all-time high. The upside potential, meanwhile, seems limited amid the underlying bullish sentiment surrounding the USD.
In fact, the USD Index (DXY), which tracks the Greenback against a basket of currencies, holds steady near a two-month high touched on Tuesday amid firming expectations that the Fed will keep interest rates higher for longer. This might continue to undermine demand for the US Dollar-denominated Gold price ahead of the crucial FOMC meeting minutes. Traders will further take cues from the US debt ceiling negotiations, which, along with the US bond yields, will drive the USD demand. Apart from this, the broader risk sentiment might further contribute to producing short-term trading opportunities around the XAU/USD.
From a technical perspective, the $1,955-$1,950 region now seems to have emerged as an immediate strong support. This is followed by the 100-day Simple Moving Average (SMA), currently pegged around the $1.935-$1,930 area. A convincing break below the latter will be seen as a fresh trigger for bearish traders and expose the $1,900 round-figure mar.
On the flip side, the $1,980-$1,984 supply zone might continue to act as a strong barrier, which if cleared decisively could trigger a short-covering rally. The Gold price might then aim to reclaim the $2,000 psychological mark and climb further towards the next relevant hurdle near the $2,020-$2,025 region. Some follow-through buying will negate any near-term negative outlook and shift the bias back in favour of bullish traders.
Technical Levels: Supports and Resistances
XAUUSD currently trading at 1971.93 at the time of writing. Pair opened at 1975.21 and is trading with a change of -0.17 % .
| Overview | Overview.1 | |
|---|---|---|
| 0 | Today last price | 1971.93 |
| 1 | Today Daily Change | -3.28 |
| 2 | Today Daily Change % | -0.17 |
| 3 | Today daily open | 1975.21 |
The pair is trading below its 20 Daily moving average @ 2002.67, below its 50 Daily moving average @ 1990.96 , above its 100 Daily moving average @ 1931.91 and above its 200 Daily moving average @ 1827.68
| Trends | Trends.1 | |
|---|---|---|
| 0 | Daily SMA20 | 2002.67 |
| 1 | Daily SMA50 | 1990.96 |
| 2 | Daily SMA100 | 1931.91 |
| 3 | Daily SMA200 | 1827.68 |
The previous day high was 1977.81 while the previous day low was 1954.28. The daily 38.2% Fib levels comes at 1968.82, expected to provide support. Similarly, the daily 61.8% fib level is at 1963.27, expected to provide support.
Note the levels of interest below:
- Pivot support is noted at 1960.39, 1945.57, 1936.86
- Pivot resistance is noted at 1983.92, 1992.63, 2007.45
| Levels | Levels.1 |
|---|---|
| Previous Daily High | 1977.81 |
| Previous Daily Low | 1954.28 |
| Previous Weekly High | 2022.18 |
| Previous Weekly Low | 1952.01 |
| Previous Monthly High | 2048.75 |
| Previous Monthly Low | 1949.83 |
| Daily Fibonacci 38.2% | 1968.82 |
| Daily Fibonacci 61.8% | 1963.27 |
| Daily Pivot Point S1 | 1960.39 |
| Daily Pivot Point S2 | 1945.57 |
| Daily Pivot Point S3 | 1936.86 |
| Daily Pivot Point R1 | 1983.92 |
| Daily Pivot Point R2 | 1992.63 |
| Daily Pivot Point R3 | 2007.45 |
[/s2If]
Nehcap Expert Advisor
The NEHCAP MT4 EA is high quality professional trading system geared to generate returns without using GRID or martingales. Each trade has strict risk per trade parameter. The pairs under management include EURUSD, GBPUSD, AUDCAD, AUDNZD,GBPAUD, EURAUD, EURCAD, CHFJPY and many more.
The system is trading live: LIVE ACCOUNT TRACKING
You can run it free. Apply for a free trial and track our account. Buy the system or use profit share mechanism to generate returns on your MT4.
Join Our Telegram Group
")


