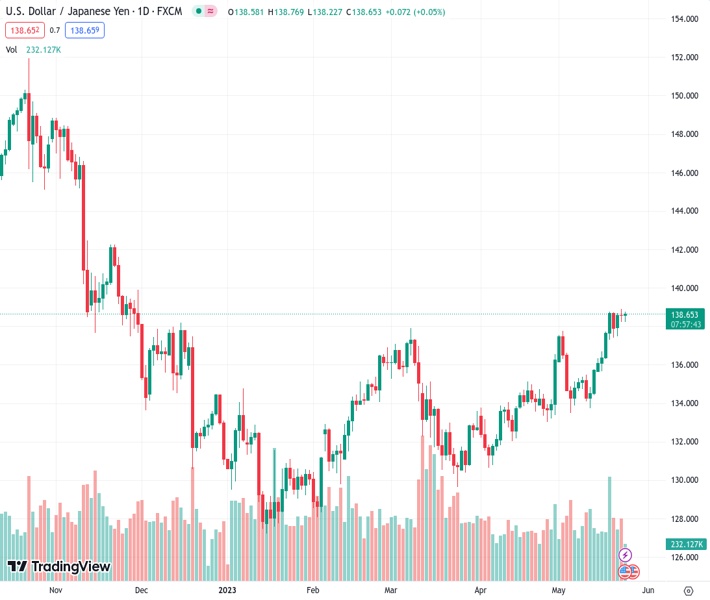
#USDJPY @ 138.690 oscillates in a narrow trading band just below the YTD peak touched on Tuesday. (Pivot Orderbook analysis)
…
This is a premium post.
[s2If !current_user_can(access_s2member_level4)]Please register for FREE REGISTER to read full post below containing analysis. In case of any error or you think you are not able to read the full post below, please email us at support#nehcap.com [lwa][/s2If] [s2If current_user_can(access_s2member_level1)]
- USD/JPY oscillates in a narrow trading band just below the YTD peak touched on Tuesday.
- A modest USD pullback from a two-month high and a softer risk tone cap gains for the pair.
- The Fed-BoJ policy divergence continues to act as a tailwind ahead of the FOMC minutes.
The pair currently trades last at 138.690.
The previous day high was 138.91 while the previous day low was 138.24. The daily 38.2% Fib levels comes at 138.5, expected to provide support. Similarly, the daily 61.8% fib level is at 138.66, expected to provide support.
The USD/JPY pair extends its sideways consolidative price move for the second straight day and remains confined in a narrow band through the early North American session on Wednesday. The pair is currently placed just below mid-138.00s and remains well within the striking distance of the YTD peak touched the previous day.
The US Dollar (USD) pulls back following an early uptick to a fresh two-month high amid a further decline in the US Treasury bond yields. Apart from this, a generally weaker tone around the equity markets drives some haven flow towards the Japanese Yen (JPY) and acts as a headwind for the USD/JPY pair. Against the backdrop of worries about a global economic slowdown, the lack of progress in talks over increasing the US debt ceiling tempers investors’ appetite for riskier assets and benefits traditional safe-haven assets.
The downside for the USD, meanwhile, seems cushioned amid firming expectations that the US central bank will keep interest rates higher for longer, bolstered by the recent hawkish comments by a slew of Federal Reserve (Fed) officials. In fact, the markets have been pricing in the possibility of another 25 bps lift-off in June. This marks a big divergence in comparison to a more dovish stance adopted by the Bank of Japan (BoJ), which continues to undermine the JPY and is seen lending some support to the USD/JPY pair.
Traders also seem reluctant to place aggressive bets and prefer to wait on the sidelines ahead of the release of the FOMC meeting minutes, due later during the US session. The minutes will be closely scrutinized for clues about the Fed’s future rate-hike path, which will play a key role in influencing the USD price dynamics and provide a fresh directional impetus to the USD/JPY pair. Nevertheless, the aforementioned fundamental backdrop favours bulls and suggests that the path of least resistance for spot prices is to the upside.
Technical Levels: Supports and Resistances
USDJPY currently trading at 138.53 at the time of writing. Pair opened at 138.58 and is trading with a change of -0.04 % .
| Overview | Overview.1 | |
|---|---|---|
| 0 | Today last price | 138.53 |
| 1 | Today Daily Change | -0.05 |
| 2 | Today Daily Change % | -0.04 |
| 3 | Today daily open | 138.58 |
The pair remains strongly bullish on the daily timeframe. It trades above its 20 SMA @ 136.03, 50 SMA 134.06, 100 SMA @ 133.29 and 200 SMA @ 137.17.
| Trends | Trends.1 | |
|---|---|---|
| 0 | Daily SMA20 | 136.03 |
| 1 | Daily SMA50 | 134.06 |
| 2 | Daily SMA100 | 133.29 |
| 3 | Daily SMA200 | 137.17 |
The previous day high was 138.91 while the previous day low was 138.24. The daily 38.2% Fib levels comes at 138.5, expected to provide support. Similarly, the daily 61.8% fib level is at 138.66, expected to provide support.
Note the levels of interest below:
- Pivot support is noted at 138.25, 137.91, 137.58
- Pivot resistance is noted at 138.91, 139.25, 139.58
| Levels | Levels.1 |
|---|---|
| Previous Daily High | 138.91 |
| Previous Daily Low | 138.24 |
| Previous Weekly High | 138.75 |
| Previous Weekly Low | 135.65 |
| Previous Monthly High | 136.56 |
| Previous Monthly Low | 130.63 |
| Daily Fibonacci 38.2% | 138.50 |
| Daily Fibonacci 61.8% | 138.66 |
| Daily Pivot Point S1 | 138.25 |
| Daily Pivot Point S2 | 137.91 |
| Daily Pivot Point S3 | 137.58 |
| Daily Pivot Point R1 | 138.91 |
| Daily Pivot Point R2 | 139.25 |
| Daily Pivot Point R3 | 139.58 |
[/s2If]
Nehcap Expert Advisor
The NEHCAP MT4 EA is high quality professional trading system geared to generate returns without using GRID or martingales. Each trade has strict risk per trade parameter. The pairs under management include EURUSD, GBPUSD, AUDCAD, AUDNZD,GBPAUD, EURAUD, EURCAD, CHFJPY and many more.
The system is trading live: LIVE ACCOUNT TRACKING
You can run it free. Apply for a free trial and track our account. Buy the system or use profit share mechanism to generate returns on your MT4.
Join Our Telegram Group
")


