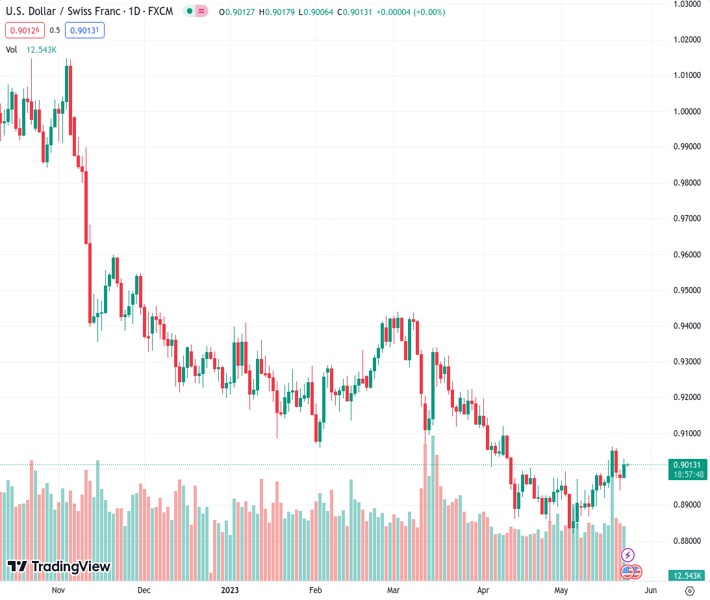
#USDCHF @ 0.90110 has displayed a recovery move from 0.9010 as investors await cues from FOMC minutes about interest rate guidance. (Pivot Orderbook analysis)
…
This is a premium post.
[s2If !current_user_can(access_s2member_level4)]Please register for FREE REGISTER to read full post below containing analysis. In case of any error or you think you are not able to read the full post below, please email us at support#nehcap.com [lwa][/s2If] [s2If current_user_can(access_s2member_level1)]
- USD/CHF has displayed a recovery move from 0.9010 as investors await cues from FOMC minutes about interest rate guidance.
- Headlines over the US debt-ceiling issues will remain in focus as the long-term credibility of the US economy is on the line.
- USD/CHF has delivered a breakout of the Wyckoff Accumulation pattern and is in a markup phase.
The pair currently trades last at 0.90110.
The previous day high was 0.9029 while the previous day low was 0.8975. The daily 38.2% Fib levels comes at 0.9009, expected to provide support. Similarly, the daily 61.8% fib level is at 0.8996, expected to provide support.
The USD/CHF pair has witnessed some recovery from the immediate support of 0.9010 in the Asian session. The Swiss Franc asset has rebounded after building a base around 0.9010 as investors are shifting their focus toward the release of May’s meeting Federal Open Market Committee (FOMC) minutes.
The release of the FOMC minutes will provide a detailed explanation behind the interest rate hike of 25 basis points (bps) by Federal Reserve (Fed) chair Jerome Powell. Also, investors will look for cues about interest rate guidance. However, Fed Powell has already advocated for a pause in the policy-tightening spell in June.
Meanwhile, the US Dollar Index (DXY) is showing a subdued performance in the Asian session. Investors will keep an eye on further developments over the US debt-ceiling issues as the long-term credibility of the United States economy is on the line.
USD/CHF has delivered a breakout of the Wyckoff Accumulation pattern formed on a four-hour scale. The Swiss franc asset is in a mark-up phase which displays wider bullish ticks and heavy volume. Upward-sloping 20-period Exponential Moving Average (EMA) at 0.9000 is providing support to the US Dollar bulls.
A confident break into the bullish range of 60.00-80.00 by the Relative Strength Index (RSI) will strengthen US Dollar bulls further.
Going forward, a decisive break above May 18 high at 0.9063 will drive the asset toward the round-level resistance of 0.9100 followed by March 28 low at 0.9137.
In an alternate scenario, a downside move below May 16 low at 0.8929 will drag the asset toward April 14 low at 0.8867. A slippage below April 14 low will further drag the asset toward the Spring formation around May 04 low at 0.8820.
Technical Levels: Supports and Resistances
USDCHF currently trading at 0.9013 at the time of writing. Pair opened at 0.9013 and is trading with a change of 0.0 % .
| Overview | Overview.1 | |
|---|---|---|
| 0 | Today last price | 0.9013 |
| 1 | Today Daily Change | 0.0000 |
| 2 | Today Daily Change % | 0.0000 |
| 3 | Today daily open | 0.9013 |
The pair is trading above its 20 Daily moving average @ 0.8943, below its 50 Daily moving average @ 0.9029 , below its 100 Daily moving average @ 0.9144 and below its 200 Daily moving average @ 0.9398
| Trends | Trends.1 | |
|---|---|---|
| 0 | Daily SMA20 | 0.8943 |
| 1 | Daily SMA50 | 0.9029 |
| 2 | Daily SMA100 | 0.9144 |
| 3 | Daily SMA200 | 0.9398 |
The previous day high was 0.9029 while the previous day low was 0.8975. The daily 38.2% Fib levels comes at 0.9009, expected to provide support. Similarly, the daily 61.8% fib level is at 0.8996, expected to provide support.
Note the levels of interest below:
- Pivot support is noted at 0.8983, 0.8952, 0.8929
- Pivot resistance is noted at 0.9037, 0.906, 0.9091
| Levels | Levels.1 |
|---|---|
| Previous Daily High | 0.9029 |
| Previous Daily Low | 0.8975 |
| Previous Weekly High | 0.9063 |
| Previous Weekly Low | 0.8920 |
| Previous Monthly High | 0.9198 |
| Previous Monthly Low | 0.8852 |
| Daily Fibonacci 38.2% | 0.9009 |
| Daily Fibonacci 61.8% | 0.8996 |
| Daily Pivot Point S1 | 0.8983 |
| Daily Pivot Point S2 | 0.8952 |
| Daily Pivot Point S3 | 0.8929 |
| Daily Pivot Point R1 | 0.9037 |
| Daily Pivot Point R2 | 0.9060 |
| Daily Pivot Point R3 | 0.9091 |
[/s2If]
Nehcap Expert Advisor
The NEHCAP MT4 EA is high quality professional trading system geared to generate returns without using GRID or martingales. Each trade has strict risk per trade parameter. The pairs under management include EURUSD, GBPUSD, AUDCAD, AUDNZD,GBPAUD, EURAUD, EURCAD, CHFJPY and many more.
The system is trading live: LIVE ACCOUNT TRACKING
You can run it free. Apply for a free trial and track our account. Buy the system or use profit share mechanism to generate returns on your MT4.
Join Our Telegram Group
")


