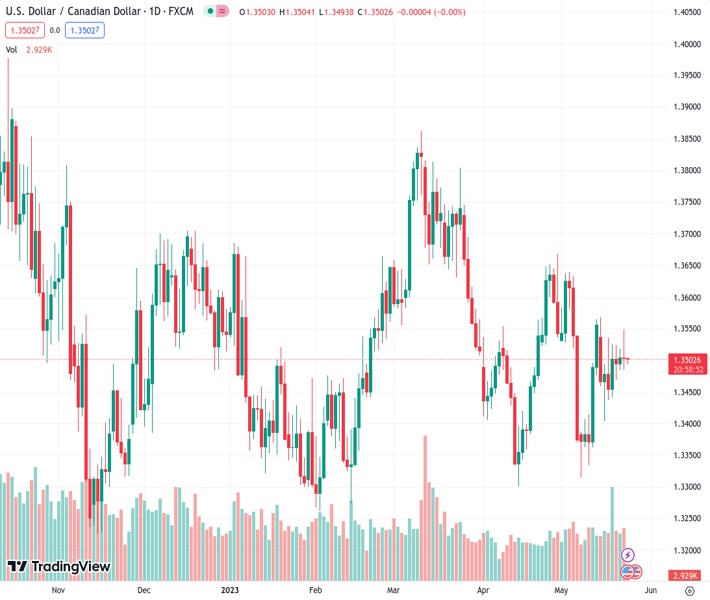
#USDCAD @ 1.35005 is oscillating in a narrow range around 1.3500 ahead of FOMC minutes. (Pivot Orderbook analysis)
…
This is a premium post.
[s2If !current_user_can(access_s2member_level4)]Please register for FREE REGISTER to read full post below containing analysis. In case of any error or you think you are not able to read the full post below, please email us at support#nehcap.com [lwa][/s2If] [s2If current_user_can(access_s2member_level1)]
- USD/CAD is oscillating in a narrow range around 1.3500 ahead of FOMC minutes.
- Republicans are not agreeing on levying extra taxes on the Wealthy community or supporting higher spending initiatives.
- The oil price has printed a fresh three-week high around $74.00 as global central banks are reaching the terminal rate.
The pair currently trades last at 1.35005.
The previous day high was 1.3519 while the previous day low was 1.3485. The daily 38.2% Fib levels comes at 1.3506, expected to provide resistance. Similarly, the daily 61.8% fib level is at 1.3498, expected to provide support.
The USD/CAD pair is demonstrating topsy-turvy moves near the psychological figure of 1.3500 in the early Asian session. The Loonie asset is expected to remain sideways ahead of the release of the Federal Open Market Committee (FOMC) minutes for May’s monetary policy meeting.
S&P500 futures have added some gains in early Tokyo after a bearish Tuesday. The overall market mood is still risk-off amid deepening issues associated with US debt-ceiling case. US House Speaker Kevin McCarthy told House Republicans during a closed GOP meeting on Tuesday that “I need you all to hang with me on the debt limit, we are nowhere near a deal yet,”
Uncertainty about US borrowing cap issue soars after US President Joe Biden called partisan terms proposed by Speak McCarthy ‘extreme’. The latter is not agreed on levying extra taxes on the Wealthy community nor is he supporting higher spending initiatives.
The US Dollar Index (DXY) is showing signs of volatility contraction after reaching near the previous week’s high above 103.62. More gains are in the pipeline ahead of the FOMC minutes, which will provide a detailed explanation behind the 25 basis points (bps) interest rate hike by the Federal Reserve (Fed). Also, it will report current economic prospects and would deliver guidance on interest rates.
Meanwhile, the oil price has printed a fresh three-week high around $74.00 as investors seem confident that the US economy will not default and would find a bipartisan deal with Republicans. Also, other central banks are reaching the terminal rate, which is easing fears of a further slowdown.
It is worth noting that Canada is the leading exporter of oil to the United States and higher oil prices will support the Canadian Dollar.
Technical Levels: Supports and Resistances
USDCAD currently trading at 1.3502 at the time of writing. Pair opened at 1.3505 and is trading with a change of -0.02 % .
| Overview | Overview.1 | |
|---|---|---|
| 0 | Today last price | 1.3502 |
| 1 | Today Daily Change | -0.0003 |
| 2 | Today Daily Change % | -0.0200 |
| 3 | Today daily open | 1.3505 |
The pair is trading below its 20 Daily moving average @ 1.351, below its 50 Daily moving average @ 1.3536 , below its 100 Daily moving average @ 1.3509 and above its 200 Daily moving average @ 1.348
| Trends | Trends.1 | |
|---|---|---|
| 0 | Daily SMA20 | 1.3510 |
| 1 | Daily SMA50 | 1.3536 |
| 2 | Daily SMA100 | 1.3509 |
| 3 | Daily SMA200 | 1.3480 |
The previous day high was 1.3519 while the previous day low was 1.3485. The daily 38.2% Fib levels comes at 1.3506, expected to provide resistance. Similarly, the daily 61.8% fib level is at 1.3498, expected to provide support.
Note the levels of interest below:
- Pivot support is noted at 1.3487, 1.3469, 1.3453
- Pivot resistance is noted at 1.3521, 1.3537, 1.3555
| Levels | Levels.1 |
|---|---|
| Previous Daily High | 1.3519 |
| Previous Daily Low | 1.3485 |
| Previous Weekly High | 1.3568 |
| Previous Weekly Low | 1.3404 |
| Previous Monthly High | 1.3668 |
| Previous Monthly Low | 1.3301 |
| Daily Fibonacci 38.2% | 1.3506 |
| Daily Fibonacci 61.8% | 1.3498 |
| Daily Pivot Point S1 | 1.3487 |
| Daily Pivot Point S2 | 1.3469 |
| Daily Pivot Point S3 | 1.3453 |
| Daily Pivot Point R1 | 1.3521 |
| Daily Pivot Point R2 | 1.3537 |
| Daily Pivot Point R3 | 1.3555 |
[/s2If]
Nehcap Expert Advisor
The NEHCAP MT4 EA is high quality professional trading system geared to generate returns without using GRID or martingales. Each trade has strict risk per trade parameter. The pairs under management include EURUSD, GBPUSD, AUDCAD, AUDNZD,GBPAUD, EURAUD, EURCAD, CHFJPY and many more.
The system is trading live: LIVE ACCOUNT TRACKING
You can run it free. Apply for a free trial and track our account. Buy the system or use profit share mechanism to generate returns on your MT4.
Join Our Telegram Group
")


