#NZDUSD @ 0.61848 remains on the back foot despite recent corrective bounce following comments from RBNZ Governor Orr., @nehcap view: Further downside expected (Pivot Orderbook analysis)
…
This is a premium post.
[s2If !current_user_can(access_s2member_level4)]Please register for FREE REGISTER to read full post below containing analysis. In case of any error or you think you are not able to read the full post below, please email us at support#nehcap.com [lwa][/s2If] [s2If current_user_can(access_s2member_level1)]
- NZD/USD remains on the back foot despite recent corrective bounce following comments from RBNZ Governor Orr.
- RBNZ’s Orr struggles to restore market’s confidence despite keeping peak rate unchanged, matching 0.25% rate hike expectations.
- Clear downside break of 200-SMA, one-month-old ascending trend line keeps Kiwi pair sellers hopeful.
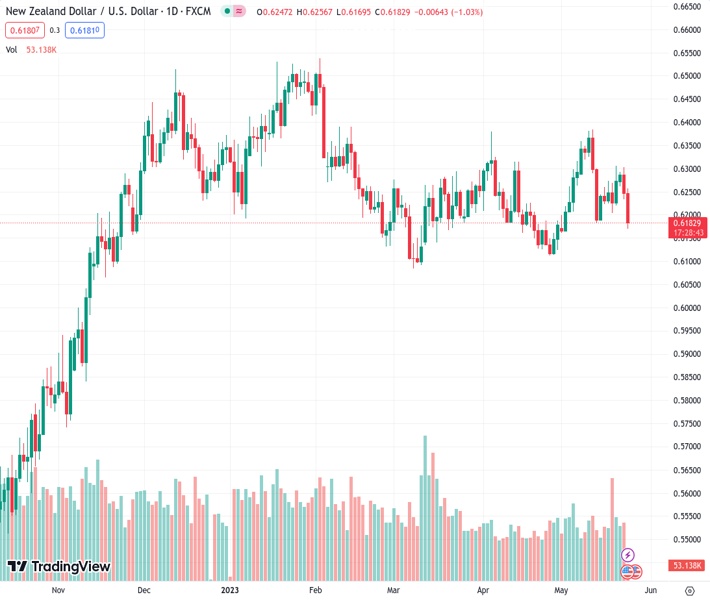
The pair currently trades last at 0.61848.
The previous day high was 0.6303 while the previous day low was 0.6233. The daily 38.2% Fib levels comes at 0.626, expected to provide resistance. Similarly, the daily 61.8% fib level is at 0.6277, expected to provide resistance.
NZD/USD remains on the back foot around a three-week low under 0.6200, close to 0.6180 by the press time, even as Reserve Bank of New Zealand (RBNZ) Governor Adrian Orr tries to placate Kiwi bears early Wednesday. That said, the quote dropped 150 pips after the RBNZ disappointed markets while keeping the peak rate unchanged, as well as matching the broad forecasts of increasing the Official Cash Rate (OCR) by 0.25%.
Also read: NZD/USD slumps below 0.6200 as RBNZ offers no hawkish surprise with 25 bps rate hike
RBNZ Governor Orr said that the latest data is satisfactory after a long battle (with inflation).
Also read: RBNZ’s Orr: Today was first time monetary policy committee went to vote for a decision
With the NZD/USD pair’s downside break of the 0.6220 key level on the dovish RBNZ bias, the sellers are likely to keep the reins amid bearish MACD signals. it’s worth noting that an upward-sloping trend line from late April joins 200-SMA to highlight 0.6220 as the key support-turned-resistance.
As a result, the Kiwi pair is well set for a fresh monthly low, currently around 0.6160. In doing so, the previous monthly bottom of around 0.6110 and the yearly trough near 0.6084 marked in March will be in the spotlight.
Alternatively, NZD/USD pair’s corrective bounce fails to push back the Kiwi buyers unless crossing the 0.6220 level.
Even so, a two-week-old descending resistance line, around 0.6305 by the press time, can challenge the NZD/USD bulls ahead of directing them to the monthly high of 0.6385.
Trend: Further downside expected
Technical Levels: Supports and Resistances
NZDUSD currently trading at 0.6181 at the time of writing. Pair opened at 0.6248 and is trading with a change of -1.07% % .
| Overview | Overview.1 | |
|---|---|---|
| 0 | Today last price | 0.6181 |
| 1 | Today Daily Change | -0.0067 |
| 2 | Today Daily Change % | -1.07% |
| 3 | Today daily open | 0.6248 |
The pair is trading below its 20 Daily moving average @ 0.6237, below its 50 Daily moving average @ 0.623 , below its 100 Daily moving average @ 0.6273 and above its 200 Daily moving average @ 0.6156
| Trends | Trends.1 | |
|---|---|---|
| 0 | Daily SMA20 | 0.6237 |
| 1 | Daily SMA50 | 0.6230 |
| 2 | Daily SMA100 | 0.6273 |
| 3 | Daily SMA200 | 0.6156 |
The previous day high was 0.6303 while the previous day low was 0.6233. The daily 38.2% Fib levels comes at 0.626, expected to provide resistance. Similarly, the daily 61.8% fib level is at 0.6277, expected to provide resistance.
Note the levels of interest below:
- Pivot support is noted at 0.622, 0.6191, 0.6149
- Pivot resistance is noted at 0.629, 0.6332, 0.636
| Levels | Levels.1 |
|---|---|
| Previous Daily High | 0.6303 |
| Previous Daily Low | 0.6233 |
| Previous Weekly High | 0.6306 |
| Previous Weekly Low | 0.6117 |
| Previous Monthly High | 0.6389 |
| Previous Monthly Low | 0.6111 |
| Daily Fibonacci 38.2% | 0.6260 |
| Daily Fibonacci 61.8% | 0.6277 |
| Daily Pivot Point S1 | 0.6220 |
| Daily Pivot Point S2 | 0.6191 |
| Daily Pivot Point S3 | 0.6149 |
| Daily Pivot Point R1 | 0.6290 |
| Daily Pivot Point R2 | 0.6332 |
| Daily Pivot Point R3 | 0.6360 |
[/s2If]
Nehcap Expert Advisor
The NEHCAP MT4 EA is high quality professional trading system geared to generate returns without using GRID or martingales. Each trade has strict risk per trade parameter. The pairs under management include EURUSD, GBPUSD, AUDCAD, AUDNZD,GBPAUD, EURAUD, EURCAD, CHFJPY and many more.
The system is trading live: LIVE ACCOUNT TRACKING
You can run it free. Apply for a free trial and track our account. Buy the system or use profit share mechanism to generate returns on your MT4.
Join Our Telegram Group
")


