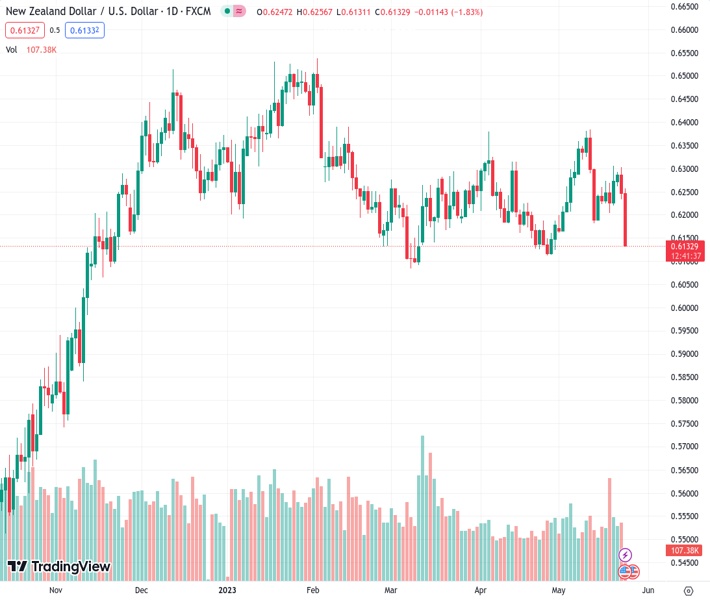
#NZDUSD @ 0.61353 comes under intense selling pressure in reaction to the FBNZ’s surprise dovish shift. (Pivot Orderbook analysis)
…
This is a premium post.
[s2If !current_user_can(access_s2member_level4)]Please register for FREE REGISTER to read full post below containing analysis. In case of any error or you think you are not able to read the full post below, please email us at support#nehcap.com [lwa][/s2If] [s2If current_user_can(access_s2member_level1)]
- NZD/USD comes under intense selling pressure in reaction to the FBNZ’s surprise dovish shift.
- The USD stands tall near a two-month high and further contributes to the steep intraday slide.
- The fundamental backdrop favours bearish traders as the focus shifts to the FOMC minutes.
The pair currently trades last at 0.61353.
The previous day high was 0.6303 while the previous day low was 0.6233. The daily 38.2% Fib levels comes at 0.626, expected to provide resistance. Similarly, the daily 61.8% fib level is at 0.6277, expected to provide resistance.
The NZD/USD pair extends the previous day’s rejection slide from the 0.6300 round-figure mark and comes under heavy selling pressure after the Reserve Bank of New Zealand (RBNZ) announced its policy decision this Wednesday. The downward trajectory remains uninterrupted through the early part of the European session and drags spot prices to a nearly one-month low, around the 0.6130 region in the last hour.
The New Zealand dollar tumbled across the board after the RBNZ caught markets off-guard and signalled it was done with its most aggressive hiking cycle since 1999. It is worth recalling that the central bank raised its official cash rate (OCR) by 25 bps earlier this Wednesday, to 5.5% – the highest level since the 2008 financial crisis. In the accompanying monetary policy statement, the RBNZ forecasts the official cash rate to peak at its current level, which, along with a bullish US Dollar (USD), prompts aggressive selling around the NZD/USD pair.
In fact, the USD Index (DXY), which tracks the Greenback against a basket of currencies, holds steady near a two-month high touched on Tuesday amid expectations that the Federal Reserve (Fed) will keep interest rates higher for longer. In fact, the markets are now pricing in the possibility of another 25 bps lift-off in June and the bets were reaffirmed by the recent hawkish comments by several Fed officials. Apart from this, worries about slowing global economic growth, further benefit the safe-haven buck and weigh on the risk-sensitive Kiwi.
The USD bulls, meanwhile, seem reluctant and prefer to wait for the release of the FOMC meeting minutes, due later during the US session. The minutes will be closely scrutinized for clues about the Fed’s rate-hike path, which will drive the USD in the near term and provide a fresh directional impetus to the NZD/USD pair. Nevertheless, the RBNZ’s unexpected dovish shift suggests that the path of least resistance for spot prices is to the downside. Hence, any attempted recovery move might still be seen as a selling opportunity and fizzle out rather quickly.
Technical Levels: Supports and Resistances
NZDUSD currently trading at 0.6135 at the time of writing. Pair opened at 0.6248 and is trading with a change of -1.81 % .
| Overview | Overview.1 | |
|---|---|---|
| 0 | Today last price | 0.6135 |
| 1 | Today Daily Change | -0.0113 |
| 2 | Today Daily Change % | -1.8100 |
| 3 | Today daily open | 0.6248 |
The pair remains strongly bearish on the daily time frame. It trades below the 20 SMA @ 0.6237, 50 SMA 0.623, 100 SMA @ 0.6273 and 200 SMA @ 0.6156.
| Trends | Trends.1 | |
|---|---|---|
| 0 | Daily SMA20 | 0.6237 |
| 1 | Daily SMA50 | 0.6230 |
| 2 | Daily SMA100 | 0.6273 |
| 3 | Daily SMA200 | 0.6156 |
The previous day high was 0.6303 while the previous day low was 0.6233. The daily 38.2% Fib levels comes at 0.626, expected to provide resistance. Similarly, the daily 61.8% fib level is at 0.6277, expected to provide resistance.
Note the levels of interest below:
- Pivot support is noted at 0.622, 0.6191, 0.6149
- Pivot resistance is noted at 0.629, 0.6332, 0.636
| Levels | Levels.1 |
|---|---|
| Previous Daily High | 0.6303 |
| Previous Daily Low | 0.6233 |
| Previous Weekly High | 0.6306 |
| Previous Weekly Low | 0.6117 |
| Previous Monthly High | 0.6389 |
| Previous Monthly Low | 0.6111 |
| Daily Fibonacci 38.2% | 0.6260 |
| Daily Fibonacci 61.8% | 0.6277 |
| Daily Pivot Point S1 | 0.6220 |
| Daily Pivot Point S2 | 0.6191 |
| Daily Pivot Point S3 | 0.6149 |
| Daily Pivot Point R1 | 0.6290 |
| Daily Pivot Point R2 | 0.6332 |
| Daily Pivot Point R3 | 0.6360 |
[/s2If]
Nehcap Expert Advisor
The NEHCAP MT4 EA is high quality professional trading system geared to generate returns without using GRID or martingales. Each trade has strict risk per trade parameter. The pairs under management include EURUSD, GBPUSD, AUDCAD, AUDNZD,GBPAUD, EURAUD, EURCAD, CHFJPY and many more.
The system is trading live: LIVE ACCOUNT TRACKING
You can run it free. Apply for a free trial and track our account. Buy the system or use profit share mechanism to generate returns on your MT4.
Join Our Telegram Group
")


